You can very quickly get an easy Stock Analysis-type view of any title list in Edelweiss, whether it’s an order, filtered search, list of Buzz titles, Tags, etc.
Getting there is as simple as clicking this icon at the top of any title list:
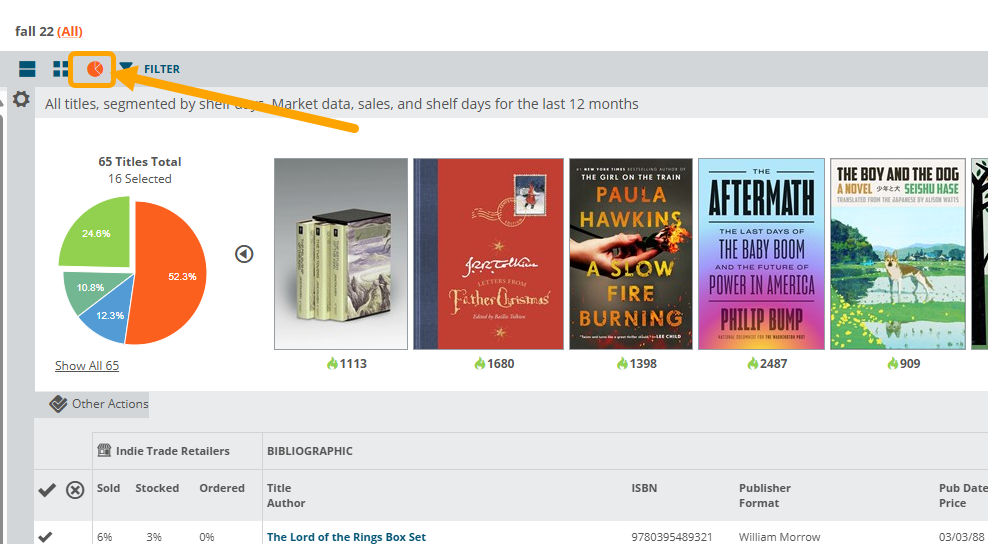
The full pie graph will represent all the titles in the current list of titles. That list will be broken down according to the usual Shelf Days parameters, as well as your current stock status. This means that for any given list of titles, you can see how they’re performing in your store, or whether you even have them in stock or on order.
You can also view this graph according to Turns, rather than Shelf Days:
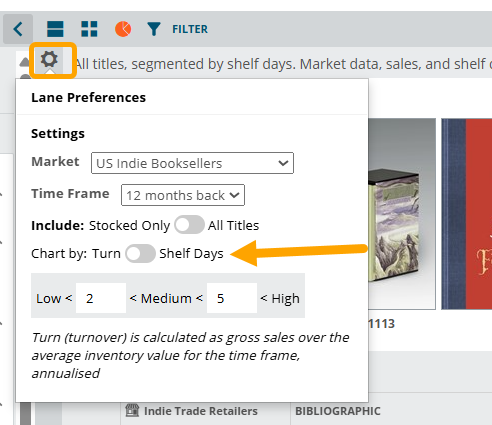 You can set your high and low Turn parameters to customize how your graph appears…basically set what you would consider high or low turns for each pie slice. Set whether you want to view all titles in this list, or just titles that you’ve stocked. This can be a great way to “grade” your buys by applying this view to an older order (older so that it has some history, of course).
See the Title Detail chart below the graph.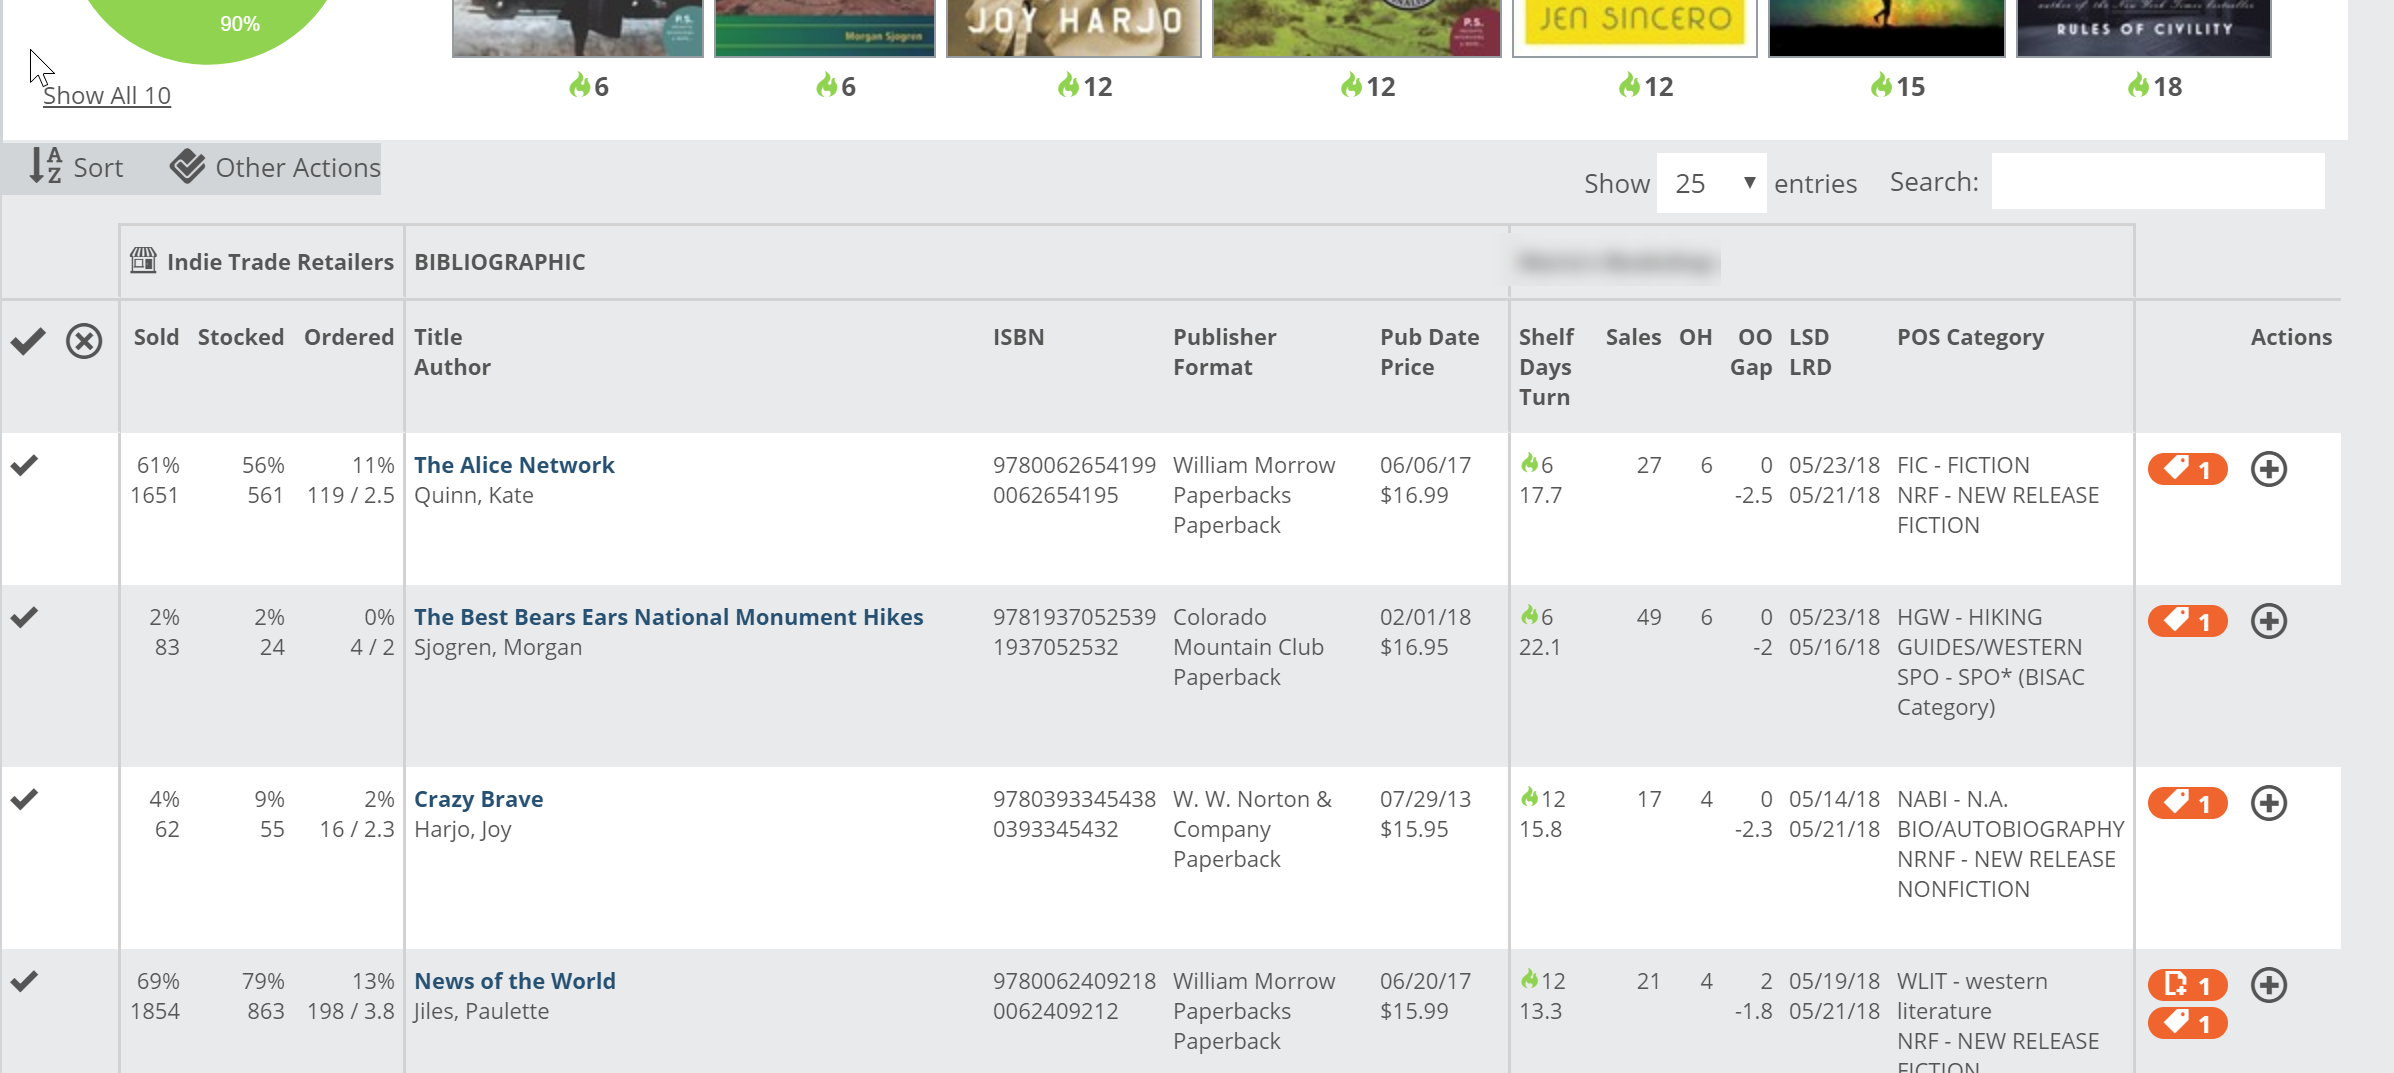
See more about reading the Title Detail chart here.
You’ll see market performance data on the far left, using the market and time frame that you’ve selected. Sales, Stock levels, and Ordered are there to help you reach a larger understanding of a title and its place in the market. The information on the right will show your own store’s performance information.
See details about a title by clicking on the title itself.
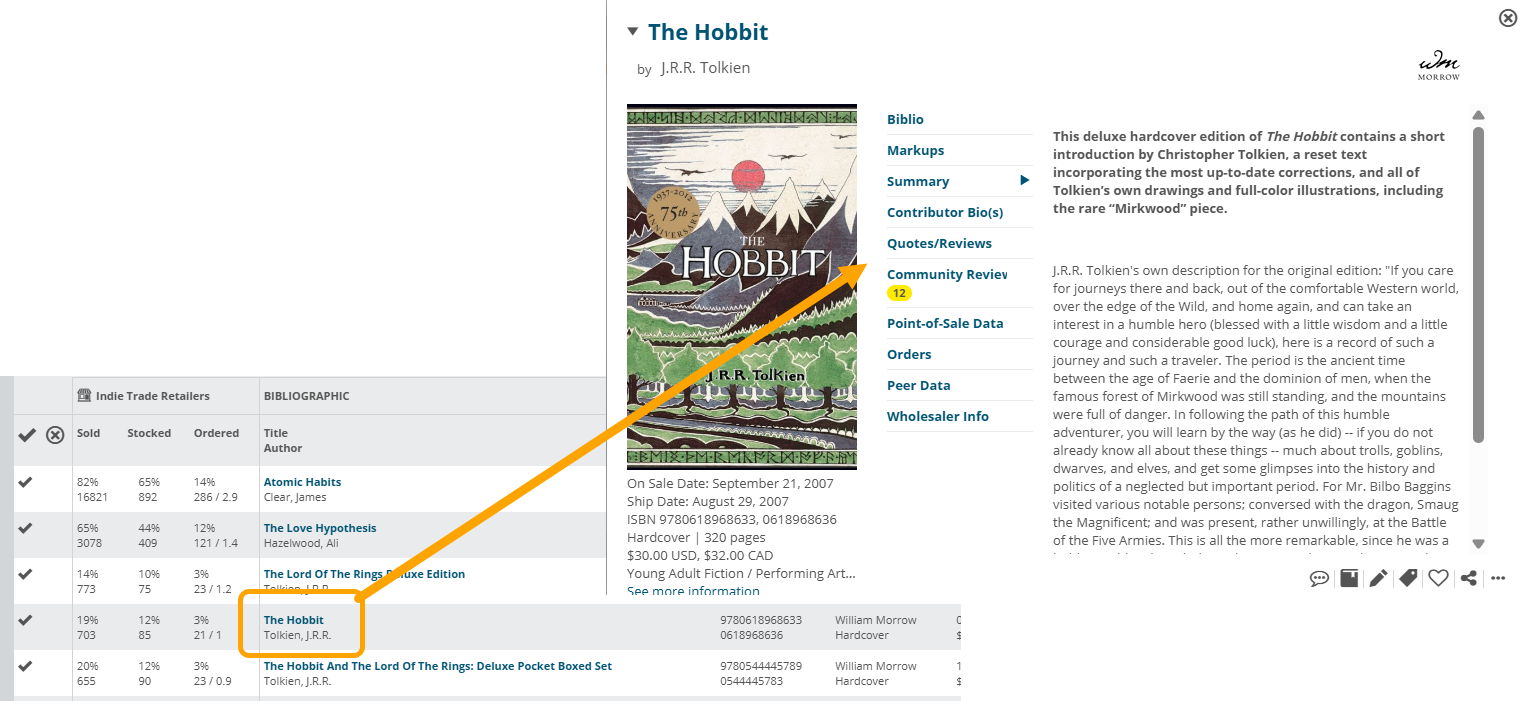
Sort the list as you like by clicking the column header, either in ascending (arrow down) or descending (arrow up) order.
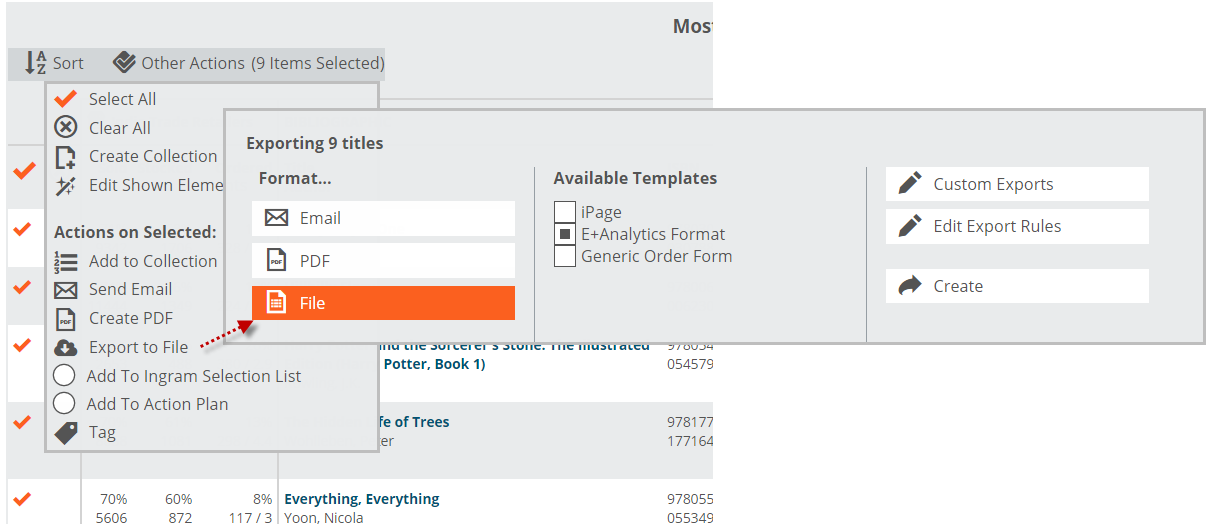
You can perform a number of the usual Edelweiss actions, including adding titles (or groups of titles) to Collections, adding Tags, emailing, Creating PDF’s, etc.
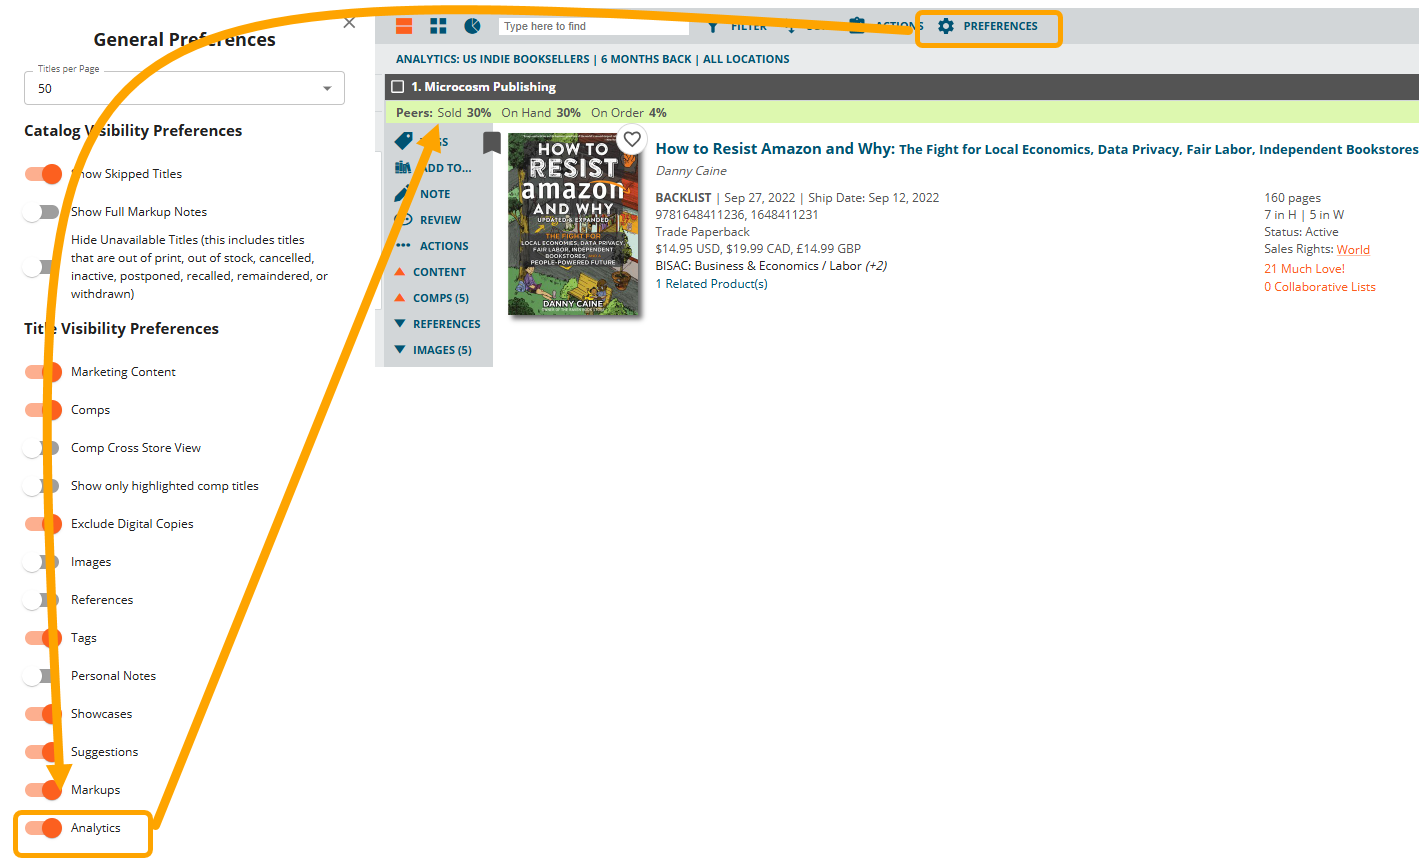
Note that you can see Peer Data and your Point-of-Sale Data on any title you find anywhere in Edelweiss:
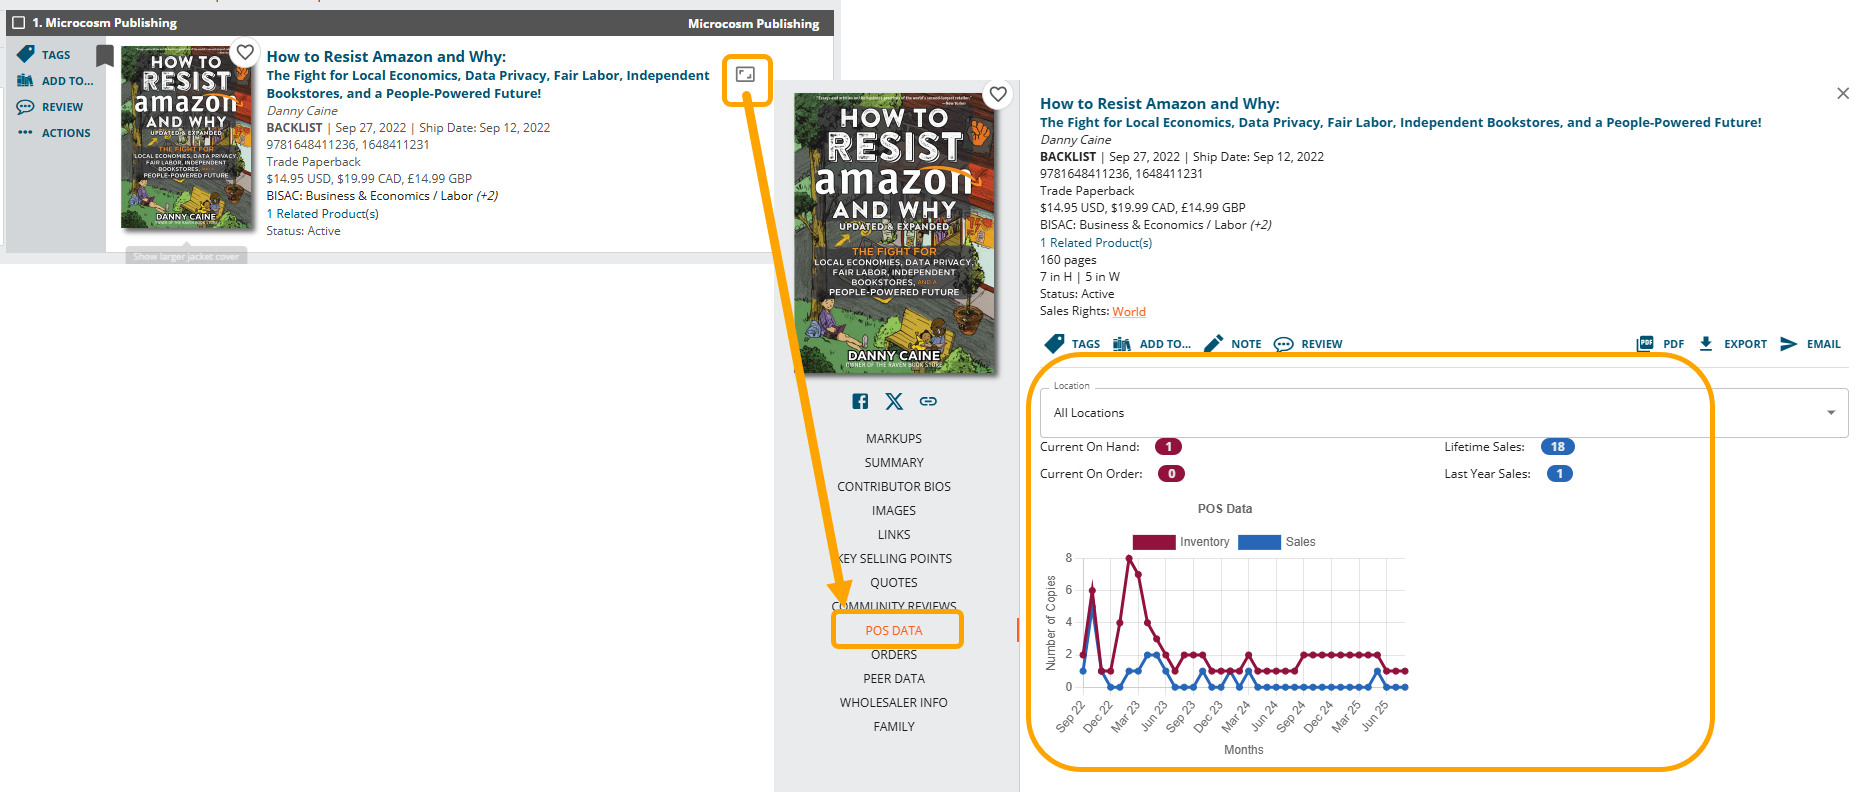
You will also be able to see a quick Sales, On Order, and On Hand percentage indicator on every title you see in Edelweiss:
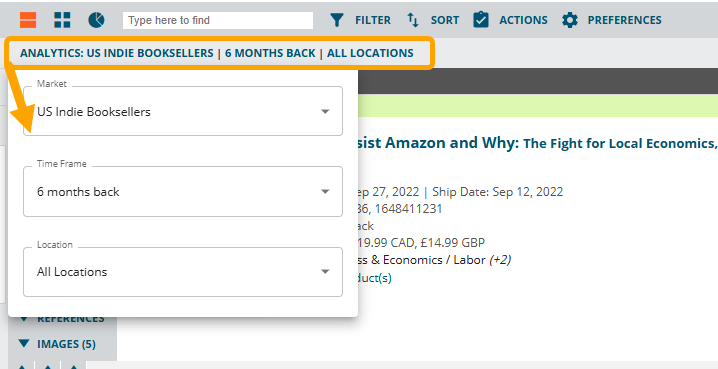
 Change the market and timeframe that this tool uses by clicking on the storefront icon:
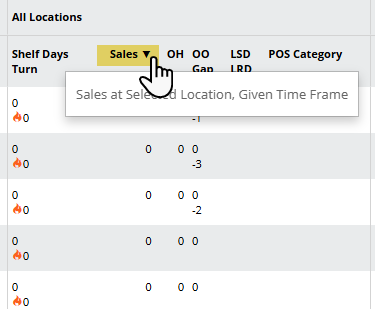
You’ll see your own store’s status with that title, too, on the far right of this green bar:
 That bit there shows Sales | On Hand | On Order
Note: Shelf Days is not taken into consideration on this bar, so percentages here may differ from your Analytics page depending on your Shelf Days filter parameters.
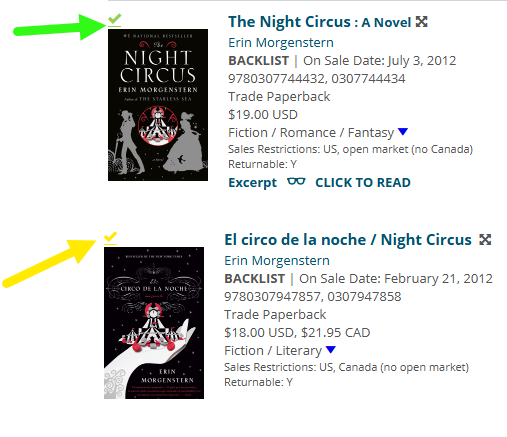
You will also see a green checkmark on the book cover in a title listing if you currently have that title on hand (as of your last data feed to us, which should have been ‘last night’), or a yellow checkmark if you have the title on order.