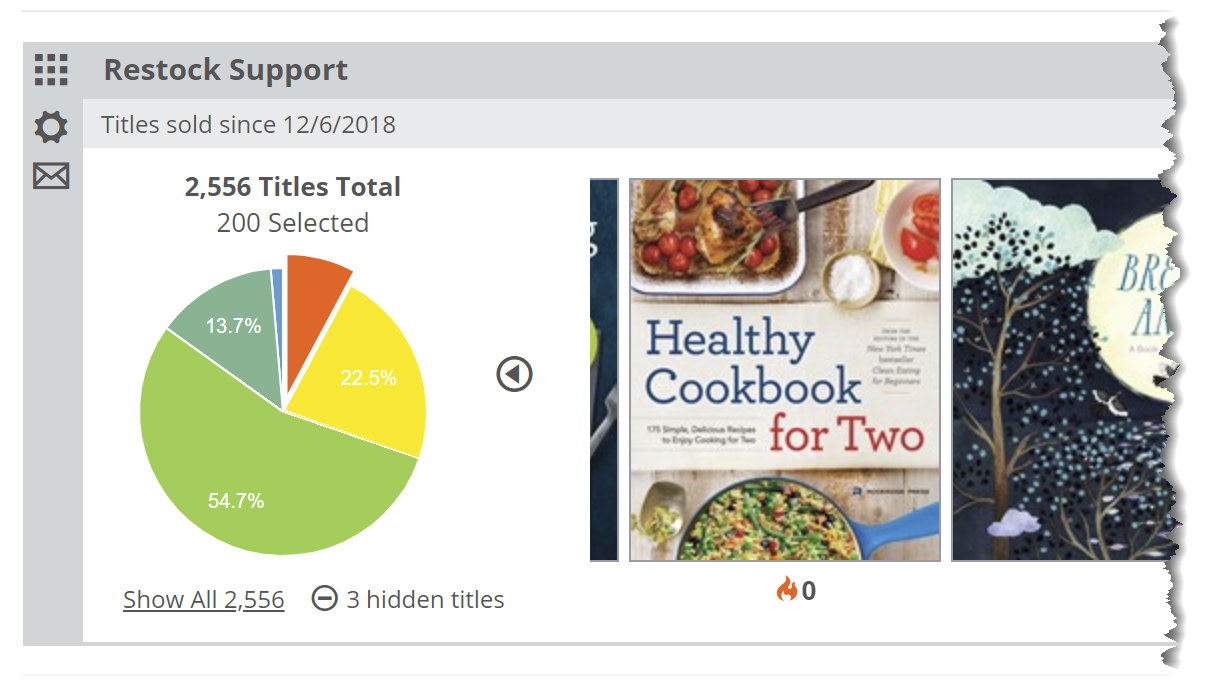
The Restock Support graph is a bit different than the other Analytics graphs, as it will, by default, only show titles within a specific set of parameters. See details here about setting those parameters.
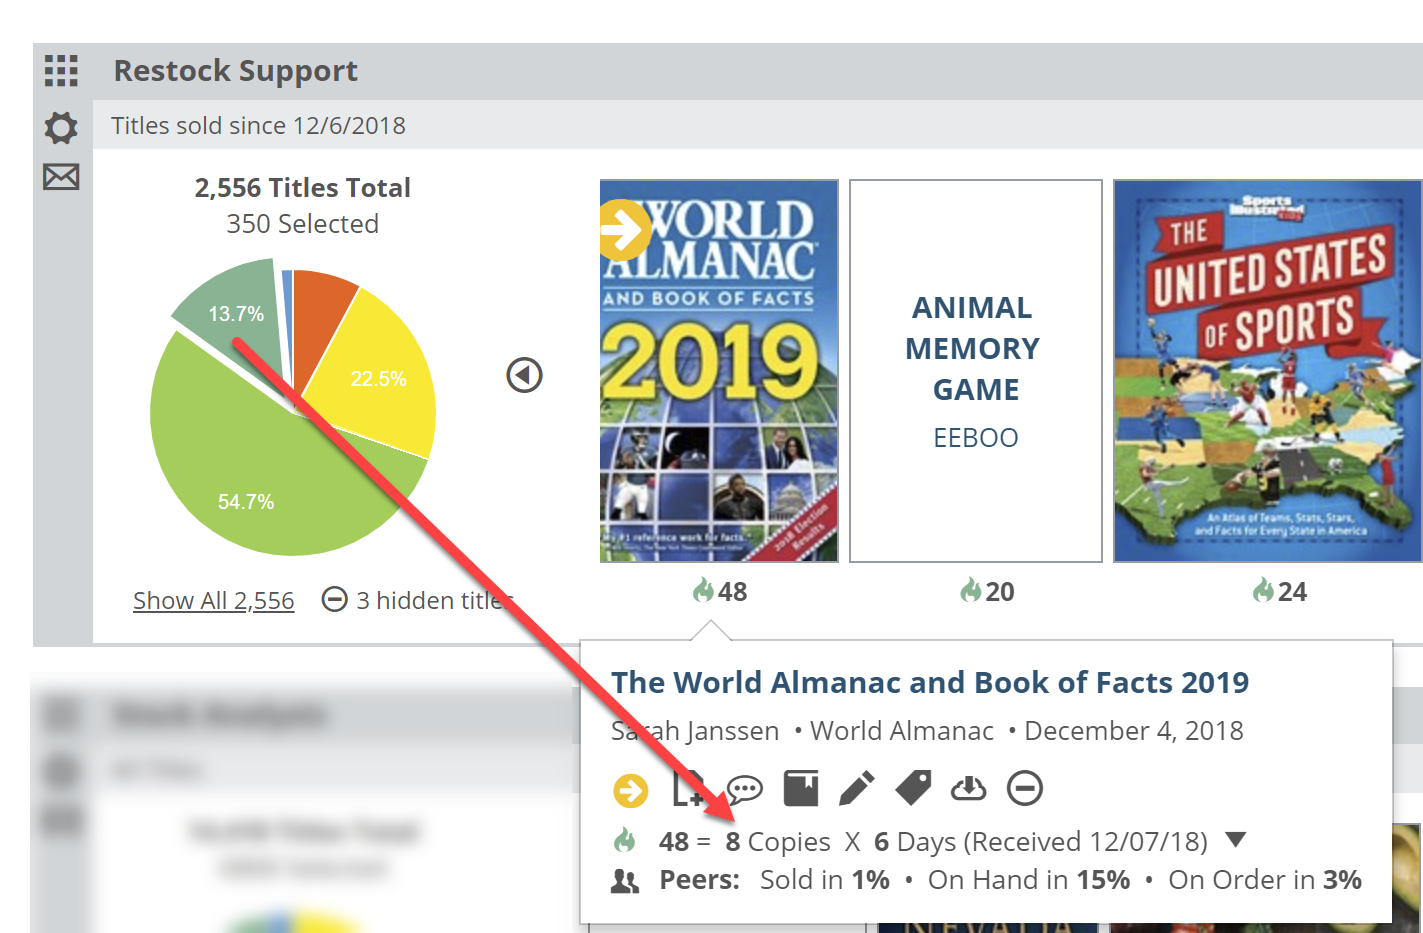
The graph itself will show titles that have sold in your store since a specific date. So, only those titles that have sold will actually show here. You’ll see titles that you’ve already re-ordered in the yellow pie wedge, titles that you have not yet re-ordered in the red, and then in-stock titles will show according to their performance (according to the Shelf Days measurement).
The yellow and red pie wedges are key here, titles that are out of stock and either on their way back in or not. Reviewing those red-wedge titles first is key. You want to be sure that titles that are actually selling at your store are back in stock as soon as possible. That’s assuming that a title should be re-ordered. If it’s something that has been sitting on your shelf for years before this sale, it could likely stay away.
The other wedges in the pie graph will show titles that have already been re-ordered and received, or titles of which you have multiple copies. Most titles will land in the green wedge, since these titles have just recently sold. Those titles that land in the blue wedges will usually be those that you have in multiple quantities and that really don’t move as they should, given that investment.
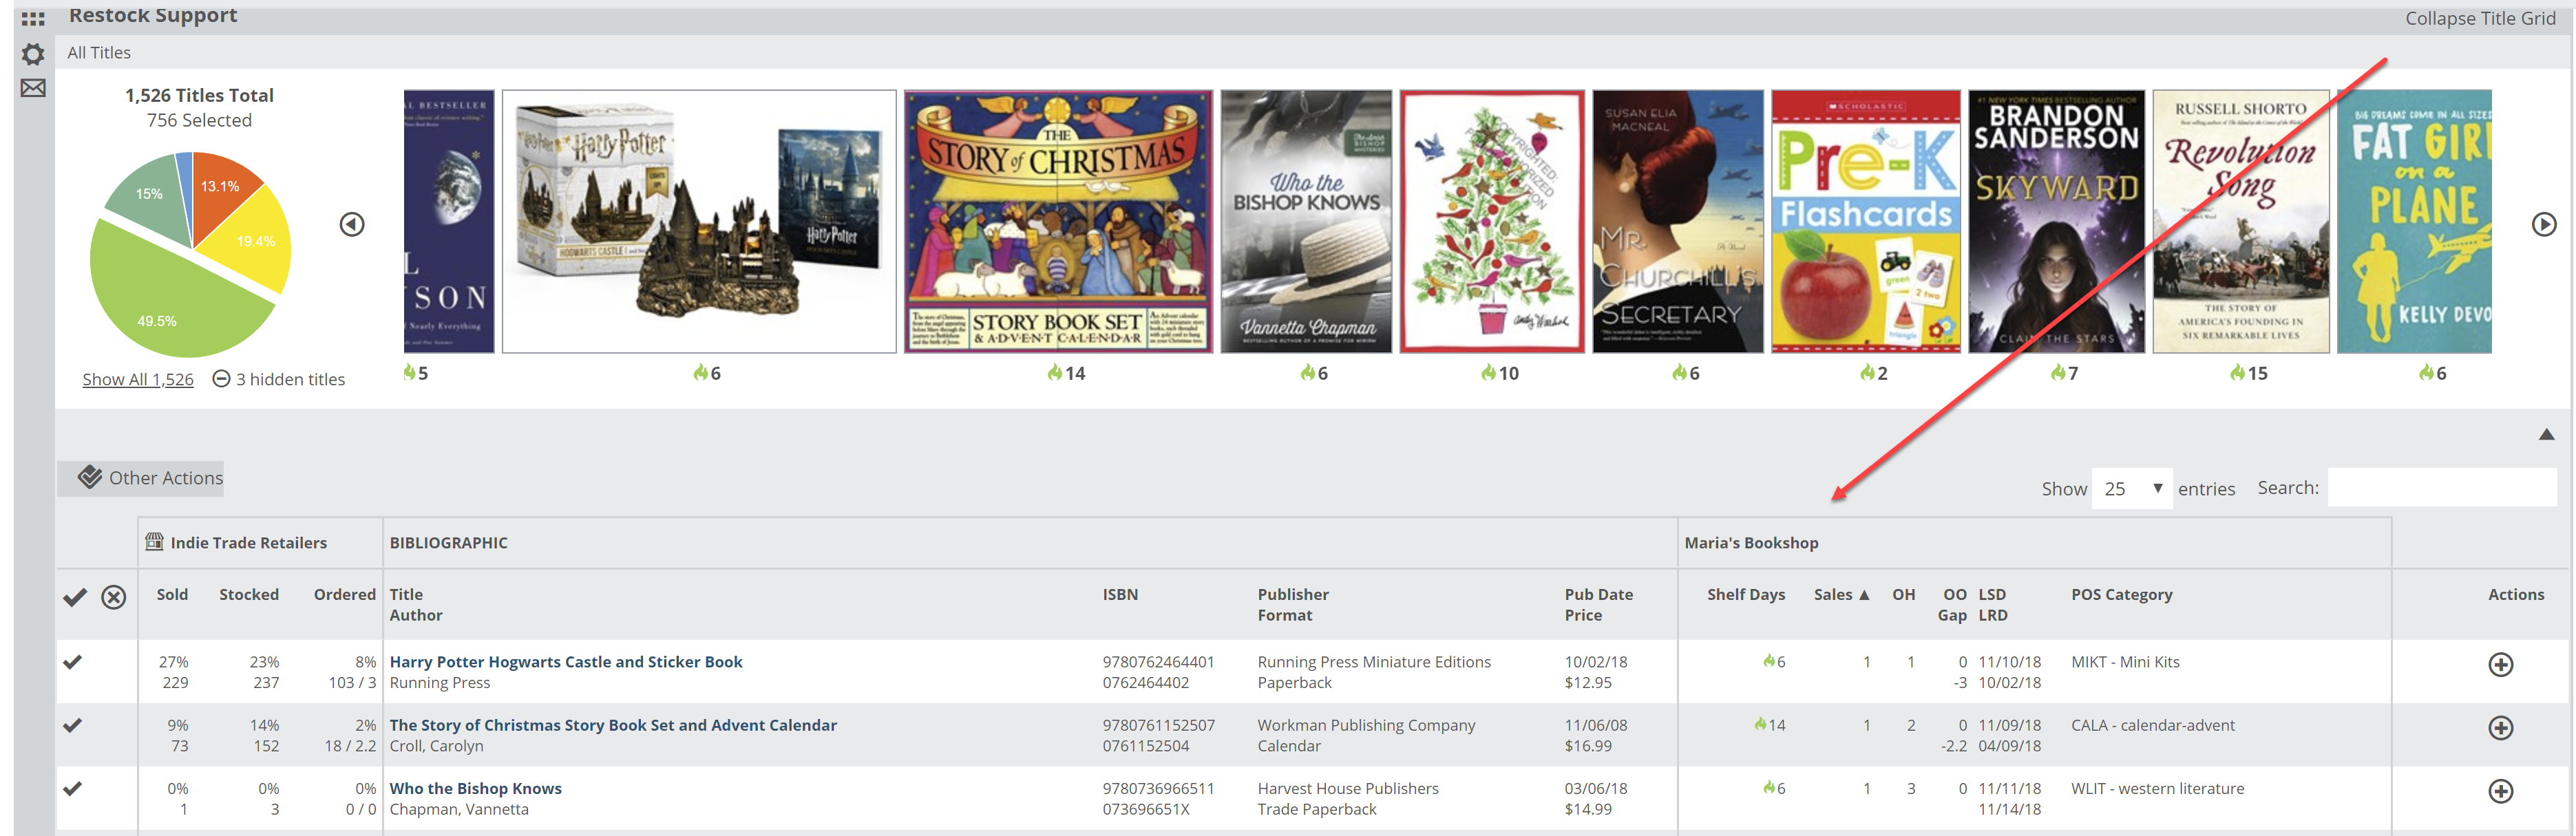
To see details of the list of titles, click here to View Titles in Grid.
You’ll see market data, as well as your own store’s history.