
Click the View as List icon in the upper right of the Location Performance Comparison lane to see details about the relative performance of each of your locations.:
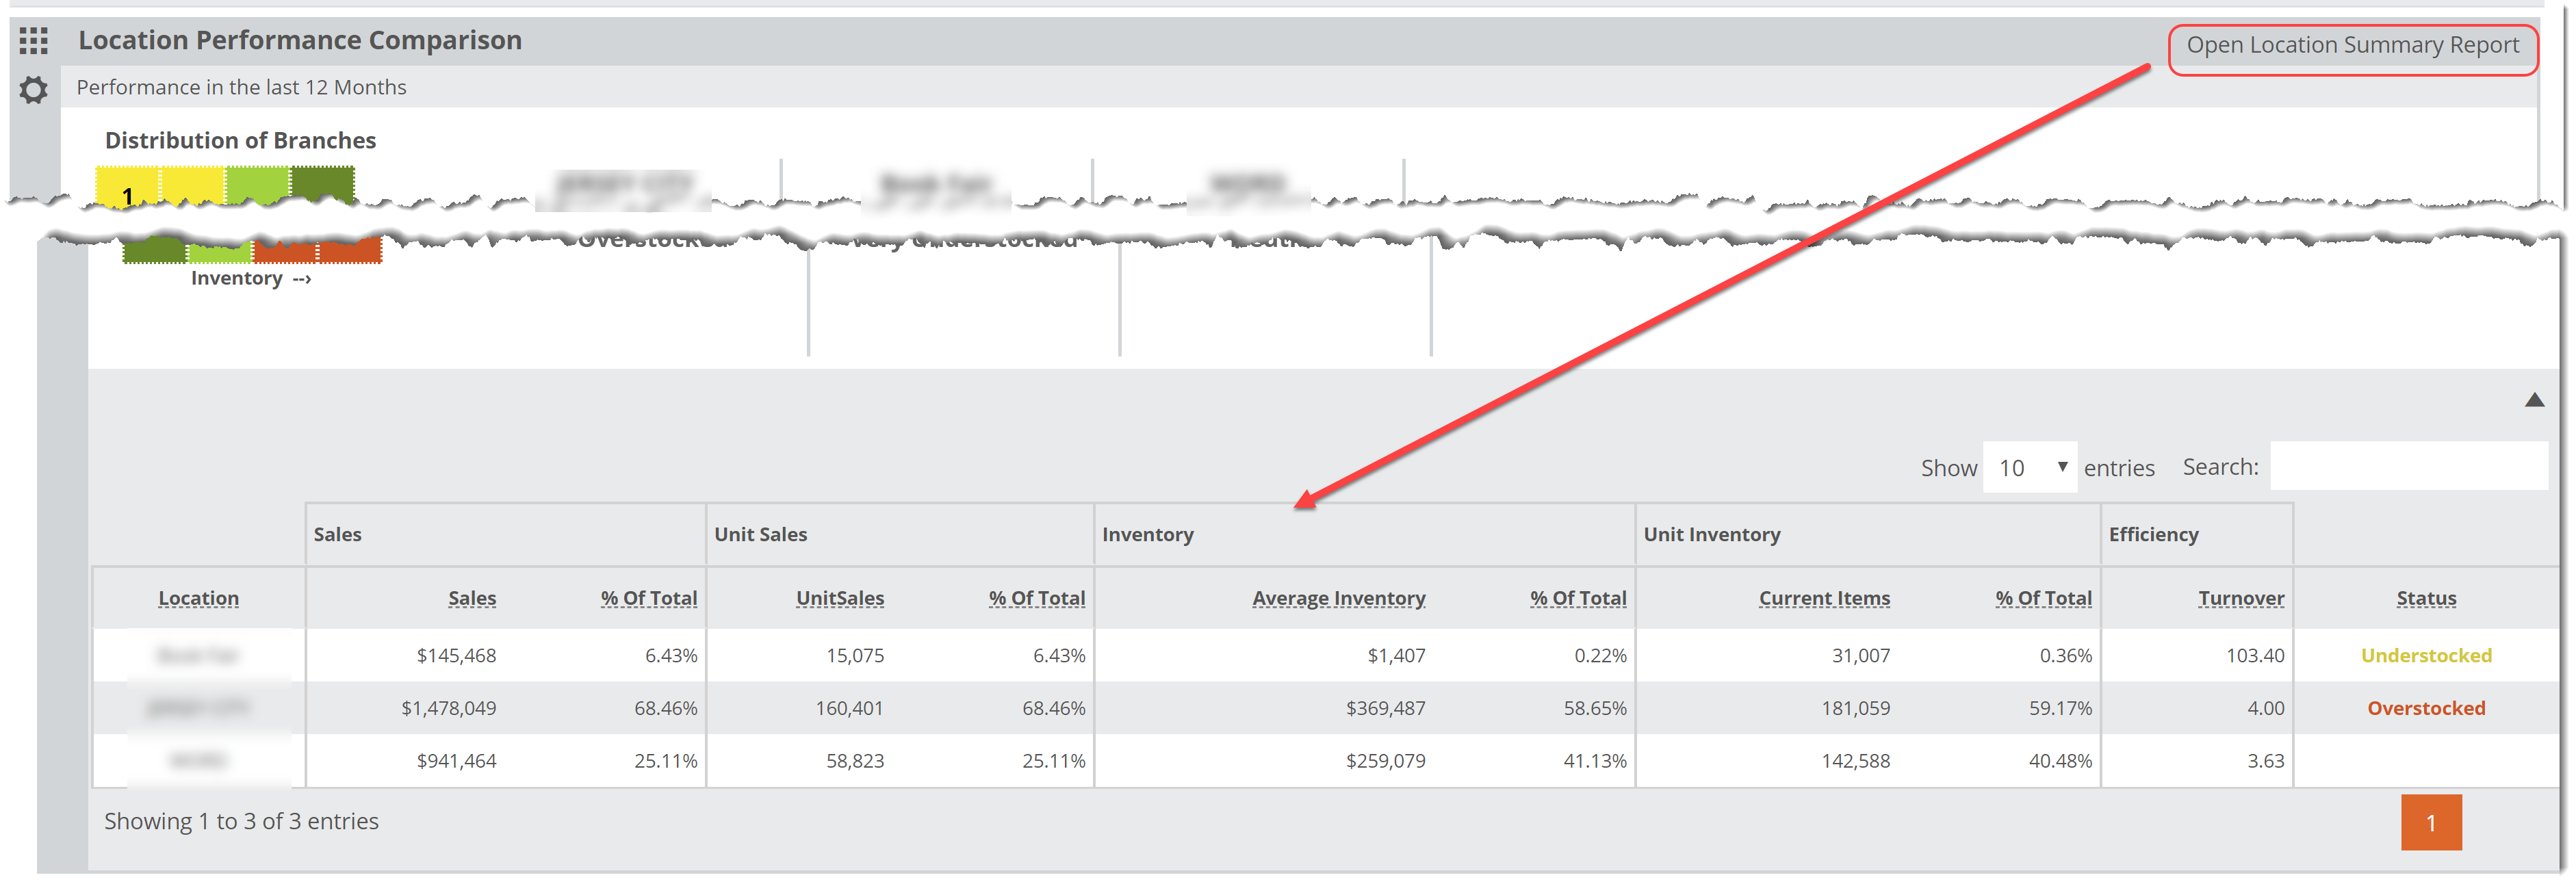
You’ll be able to see, based on the timeframe you selected and any Saved Filters you’ve set, details about the Sales, Inventory Size and Efficiency at each location. Let’s look at each section:
Location:
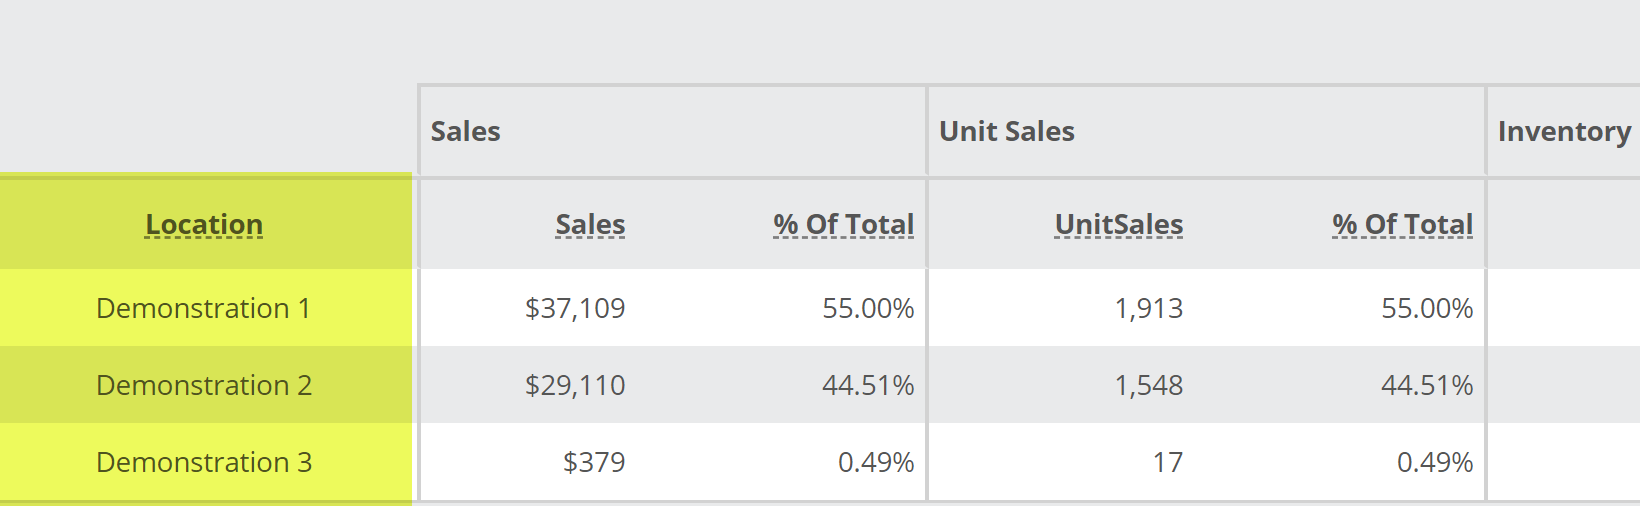
Hopefully you recognize your branches in the Location column. If not, you might be logged in to the wrong account… we kid, we kid.
Sales:
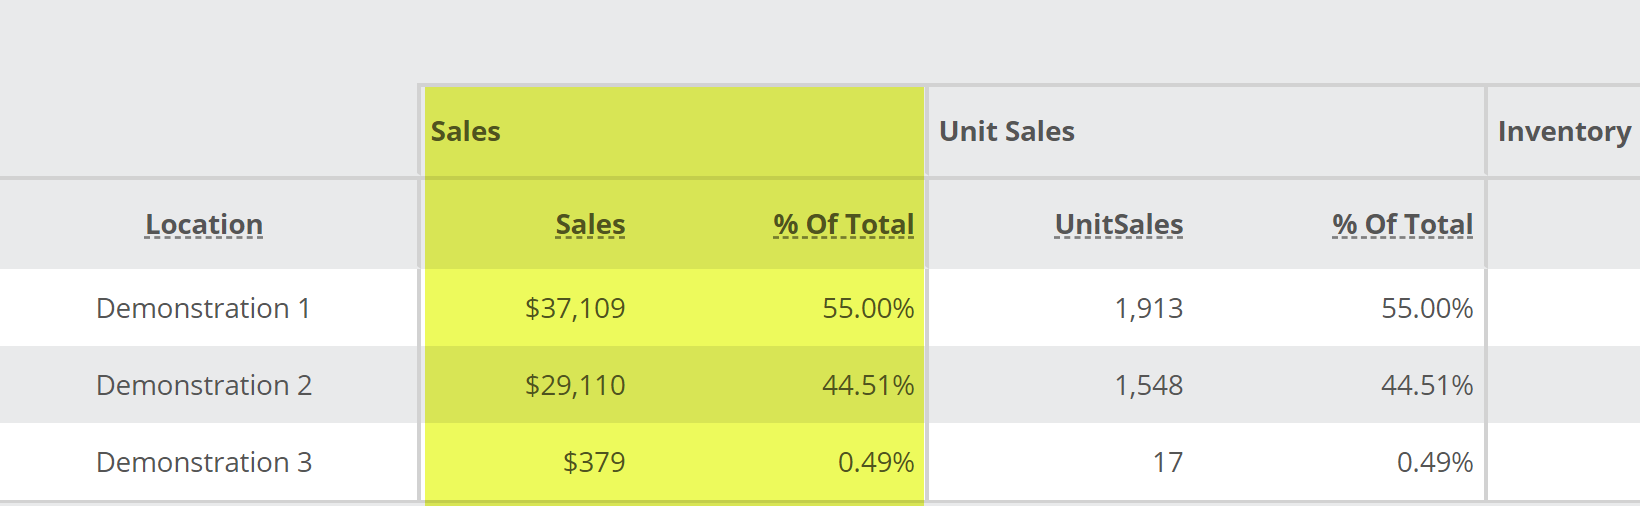
Within the selected filters, what we re the gross sales at each location? You’ll see that number in the Sales column. % of Total shows the percentage of your TOTAL sales represented by each store. In the image above, the Demo 1 location accounts for 55% of the total sales, while the Demo 2 location accounts for an almost-as-hefty 44%.
Unit Sales:
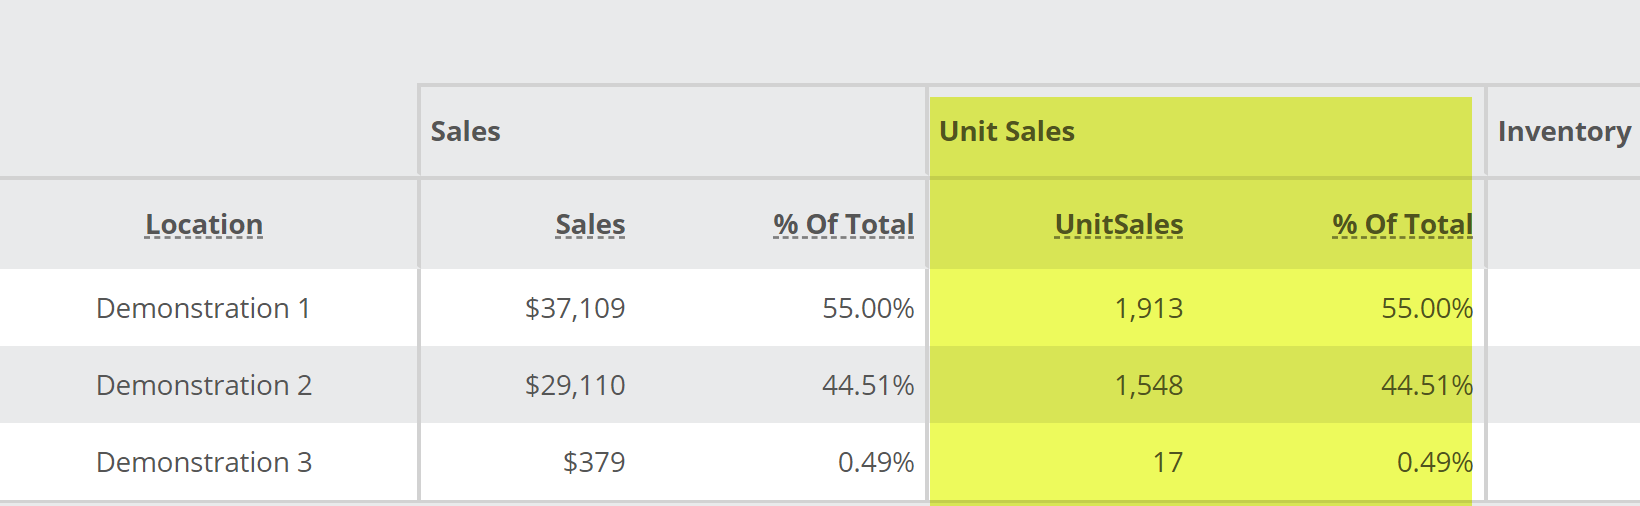 The number of copies sold at each location.
Inventory:
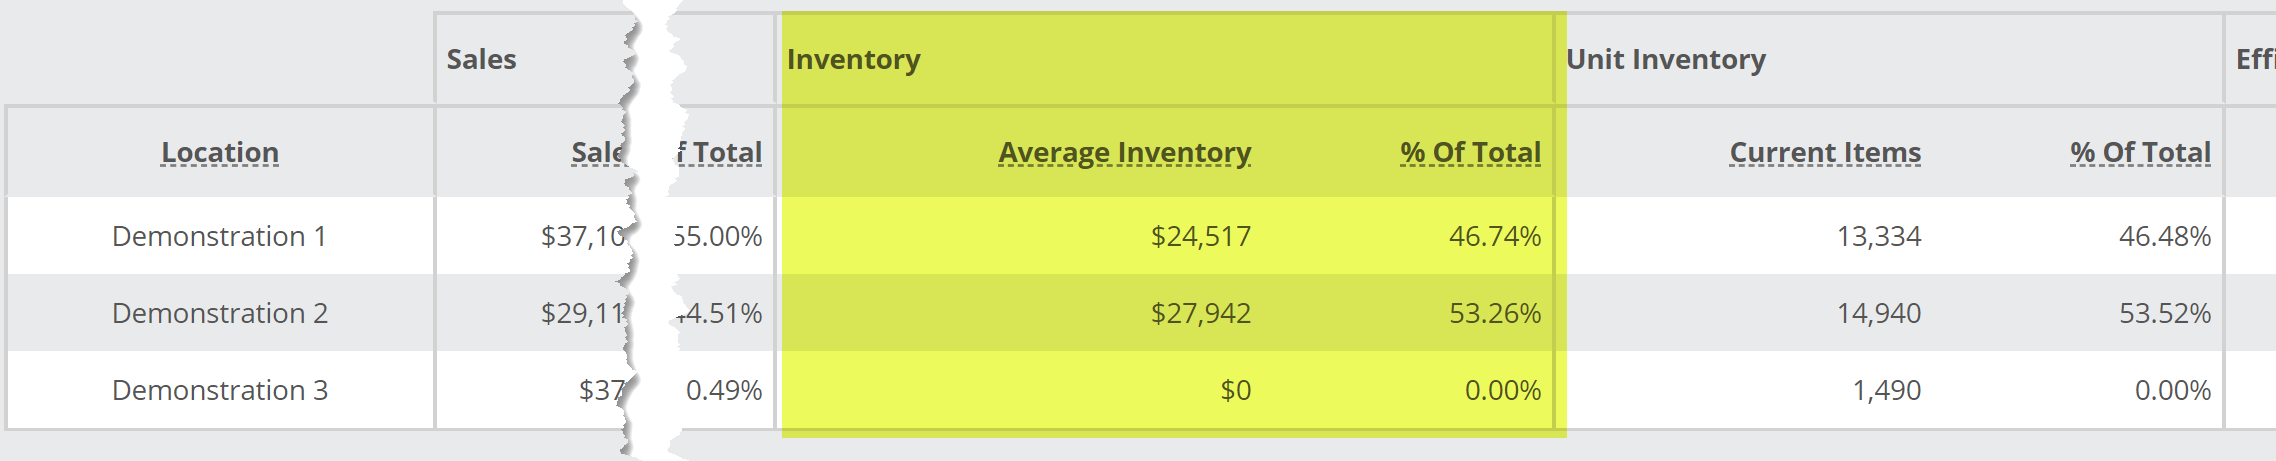 Average Inventory represents the gross $ value represented by each store (average inventory in the selected time frame, as inventory values fluctuate day-to-day), and the % of Total represents the % of the total inventory each store represents.
Unit Inventory:
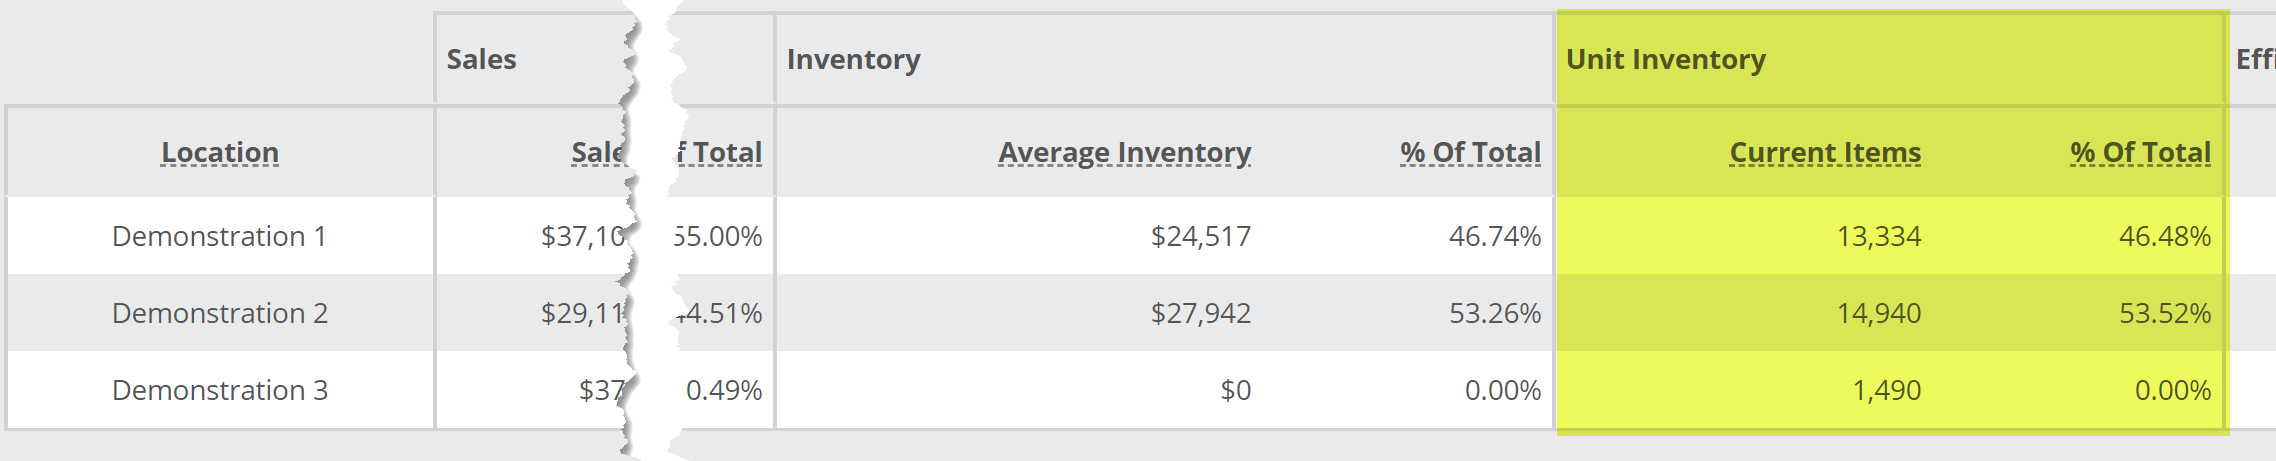 The Current Items column indicates the total number of items currently stocked (again, within the confines of any filters you’ve set) at each of your stores. % of Total indicates the percentage of your total inventory for which each store is responsible.
Efficiency:
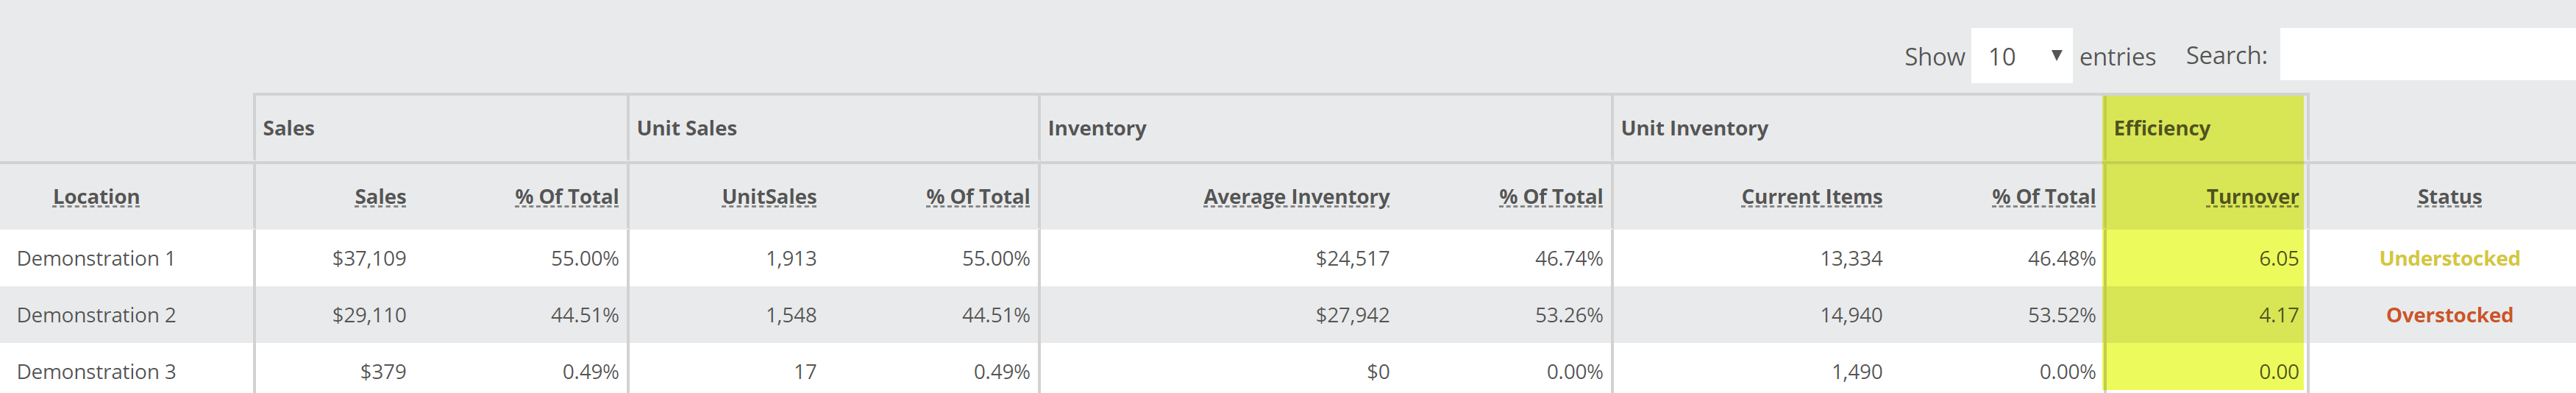
Annual Turnover indicates the number derived from the Sales versus Inventory equation. You may have a target turn number in mind, but remember that the higher the number the better, for the most part. The top 2 locations are really looking pretty great in the image above.
The Status column indicates if a store is clearly over-or-understocked. Essentially, if the Inventory Size greatly outstrips the Sales numbers, it might benefit from some returns, and vice-versa.This is indicated by the fact that the Demo 2 store has close to the same amount of inventory as Demo 1, but the sales, and therefore Turns, are a bit lower.