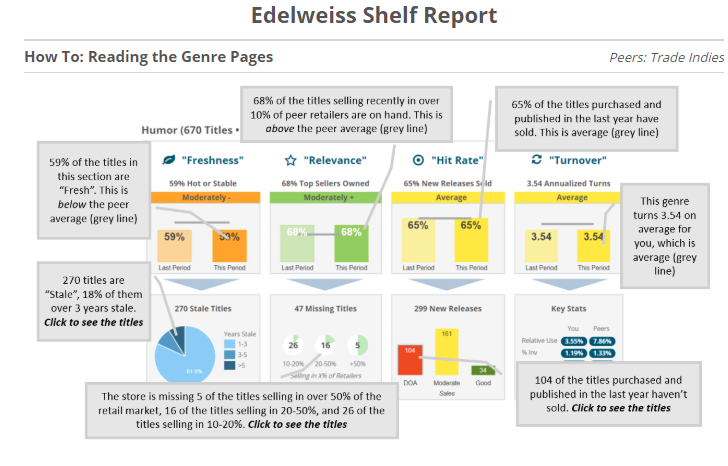
Note that Page 3 of your Shelf Report indicates how to read the Genre Detail Pages:
 We’ll dive in a bit deeper, though.
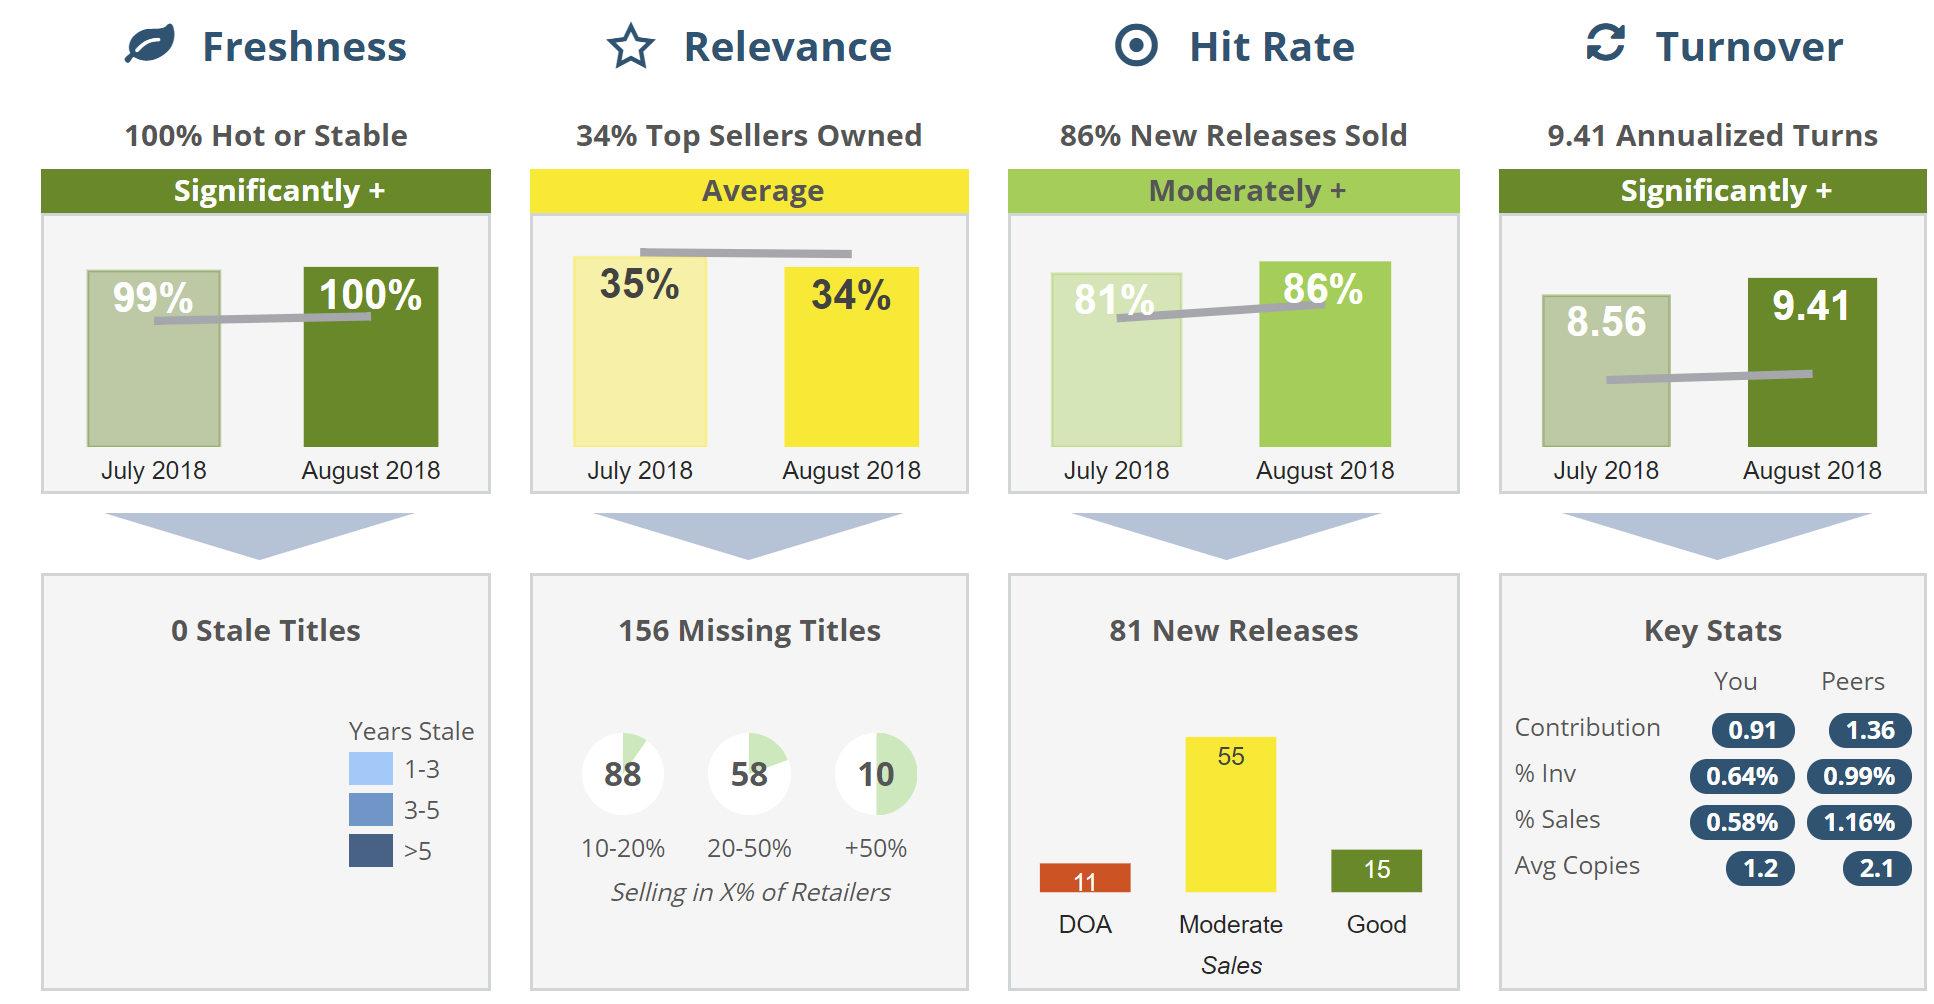
Freshness: Using the Edelweiss Analytics Shelf Days analysis, an overall measure of the % of your own inventory that is selling well, or not.
- A “Shelf Days” measure is calculated for every item on hand
- Shelf Days = # of Copies On Hand multiplied by the days since last activity (sold, received, added to system)
- Example: 4 copies of a title last sold 60 days ago would have a Shelf Days value = 240
- Anything with a Shelf Days value less than 365 (1 ‘copy/year’) is “Fresh”, anything over that is “Stale”
- A genre’s overall “Freshness” is calculated as the number of “Fresh” titles as a % of total Titles in that genre
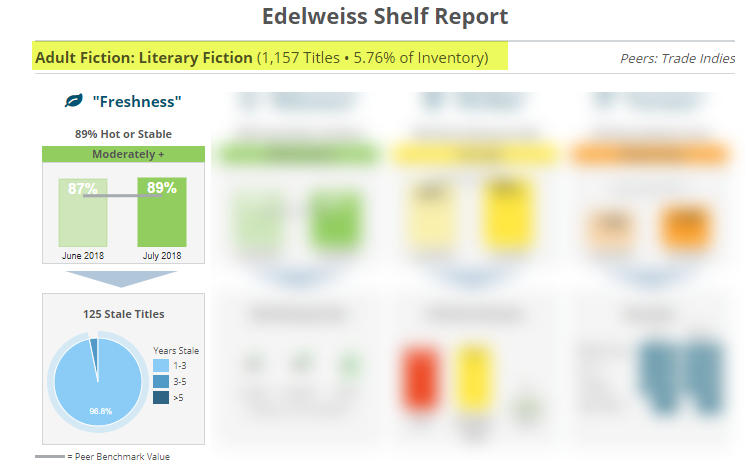
Highlighted at the top of this screen is the name of the genre, along with the total number of titles it contains, along with the % of the total inventory it represents. This store is almost 6% Literary Fiction. It has “above average Freshness,” which means that, for the most part, their literary fiction sells pretty well. They do currently have 125 titles that haven’t sold at all in a year or more. Click on a piece of that blue pie to see which titles are stale (or click on the boxes to the right if the pie section is too small to click on).
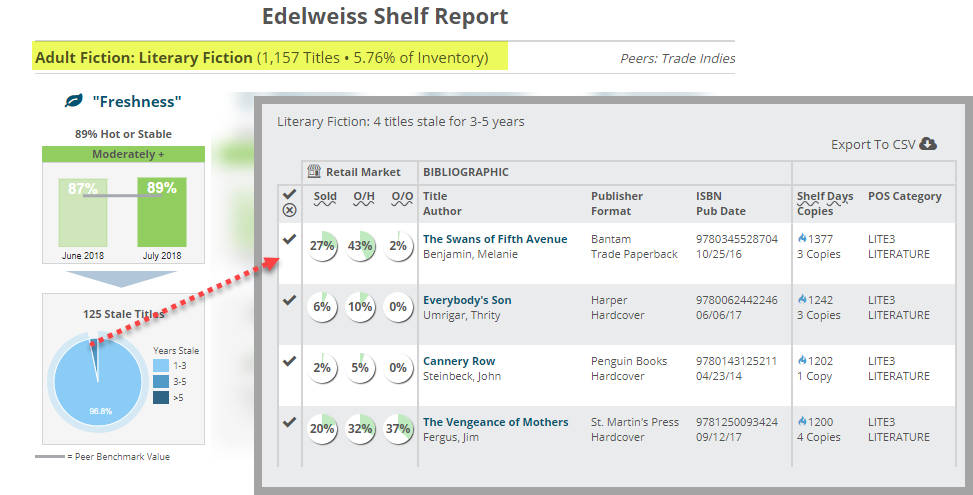
The truth here is that these may very well be great, great books. The other truth is that, unfortunately, this store’s customers are simply not interested, and that’s OK. These titles could easily, of course, be put on a display, or perhaps even on a sales cart. Note that two of them are hardcovers with multiple copies on hand. They should most likely just be returned. You could easily print this out as a “return pull list” by clicking Export to CSV in the upper right.
Relevance:
Do you stock titles that are selling well around the market?
- We identify the titles selling in over 10% of the Indie bookstores across the country in the last 6 months (nearly 500 Indies report to us on daily basis)
- The titles are grouped by “family” — to account for different editions / ISBNs of the same title
- Your inventory is analyzed against this list to determine what % of these titles / families you stock by genre
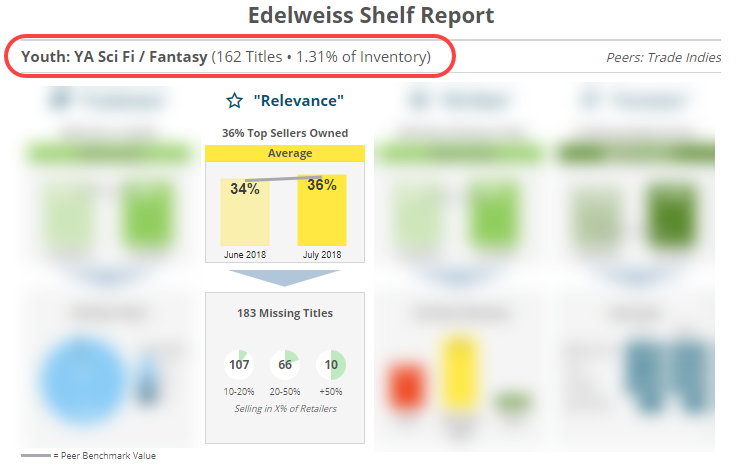
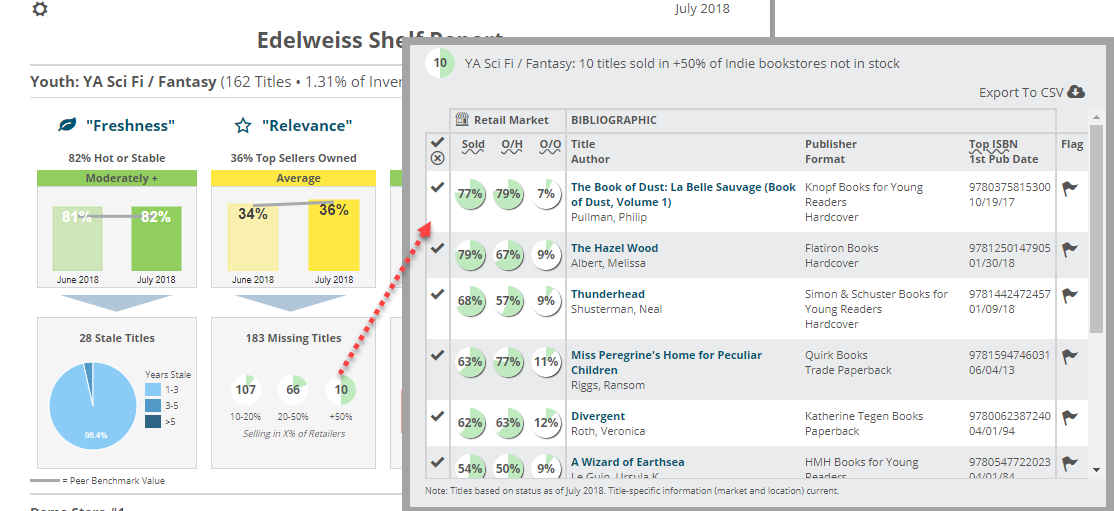
This store stocks 36% of the Young Adult Fantasy/Sci-Fi titles that other bookstores have sold in the last 6 months. They’re currently missing 10 titles that the majority of stores are selling. In fact, they’re missing some very big (popular) books:
It’s worth noting that there are currently also 28 titles that show up in the Freshness graph as stale (unsold). This view sort of screams for a swap-out of stale titles for some much more relevant titles.
Note, too, that the gray bar in the top graph represents the average On Hand % value across the indie trade market (Peer Benchmark).
It’s quite true that each store has its own personality, and each community has its own distinctive tastes. It’s also true that the process of buying for a bookstore is largely based on assumptions and guesses, at least for frontlist buying. Assumptions and guesses can and will be incorrect at times, but here you have a valuable method for “course correction,” as it were. Bring new stuff in to try, but be ready to react if your customers react with, “No thanks…” which works as a segue into the next measure:
Hit Rate:
Measuring buyer effectiveness, this measure shows whether or not newly stocked titles were ever sold.
- The titles analyzed here are those that you have in stock and that were published in the last 3 to 15 months
- “Hit Rate” is defined as the number of those titles that have sold at least once
- The titles that haven’t sold are affectionately labeled “DOA”
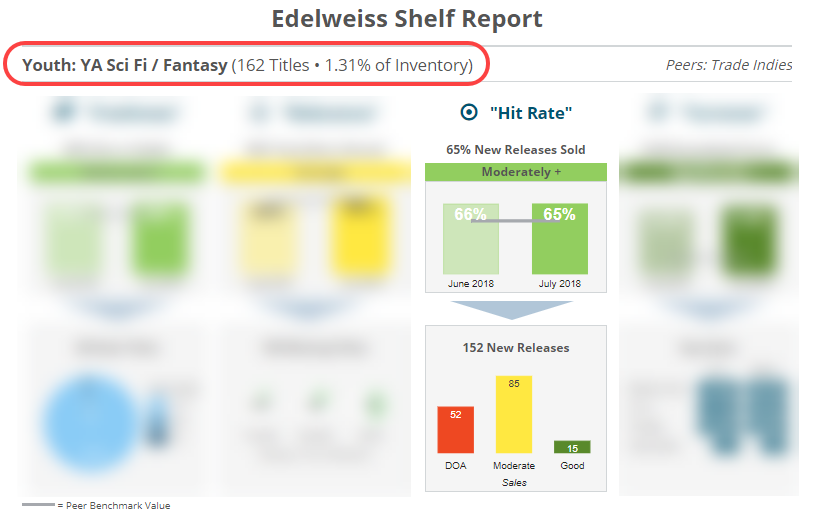
Again, measuring the YA Fantasy/Sci-Fi genre at this store, we can see that they have sold 65% of the new titles they brought in, which is a bit above the market average. The graph above indicates that sales of 15 titles were Good (sold at least 10 copies), 85 were Moderate (1-10 sales), and 52 were DOA (dead on arrival…no sales). One could reasonably expect to see most of the newly purchased titles to have moderate sales. It’s a relatively short list, and surely worth checking out, but the points of interest here are the outliers. The titles that sold the most copies were clear wins, and knowing which titles those are will only serve to better inform you on the titles that do the best in this genre.
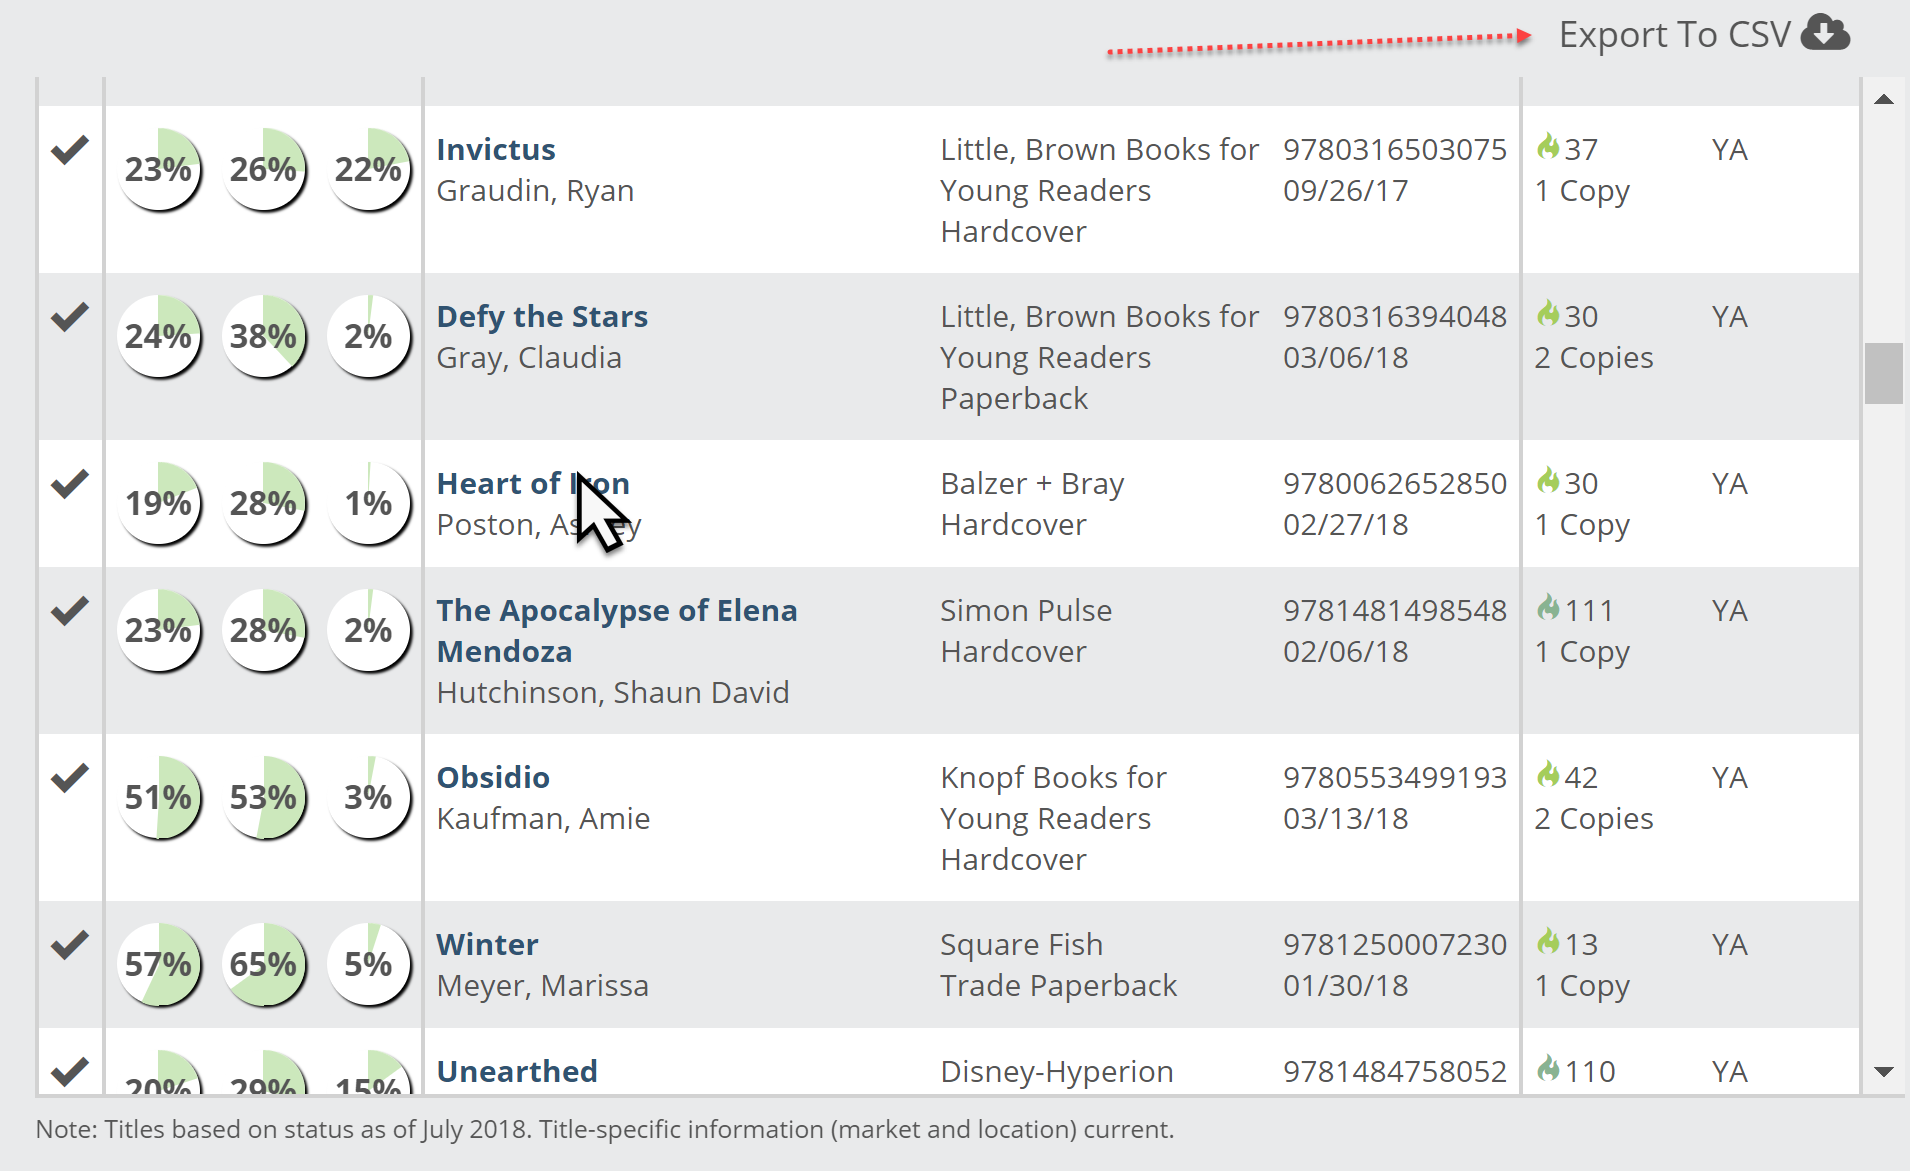
Of course, going the other direction, you definitely want to know which titles never even sold. If you can come up with a reason why, that would of course be ideal. Printing the list and taking a trip to the shelves might be painfully illuminating. Display issues are relatively easy to fix, but those intangible reasons that your customers are simply not interested in a title (or 52 titles) are worth exploring. Obviously, allowing that information to inform future buys is probably a wise course of action. Click in each column to see a list of those titles. In that list, click on a title to see its page in Edelweiss.
Turnover:
Turns indicate how many times per year the average title sold, a good overall measure for how hard your inventory is working for you.
- Inventory turnover is a very common retail measure used to look at the overall efficiency of a store’s inventory
- The calculation is as follows: Total 6 month sales divided by the average inventory (in dollars) — and then multiplied by 2 to annualize the number
- Theoretically, inventory turns represent the number of times per year the average title sold
This measure essentially indicates not only how briskly your titles sell, but whether or not you’re overburdened with unsold inventory. As a general rule of thumb, a turn level of 3 indicates a relatively healthy inventory. Inevitably, if you see a genre with low turns, you’ll also see a large amount of Stale inventory in the Freshness measure.
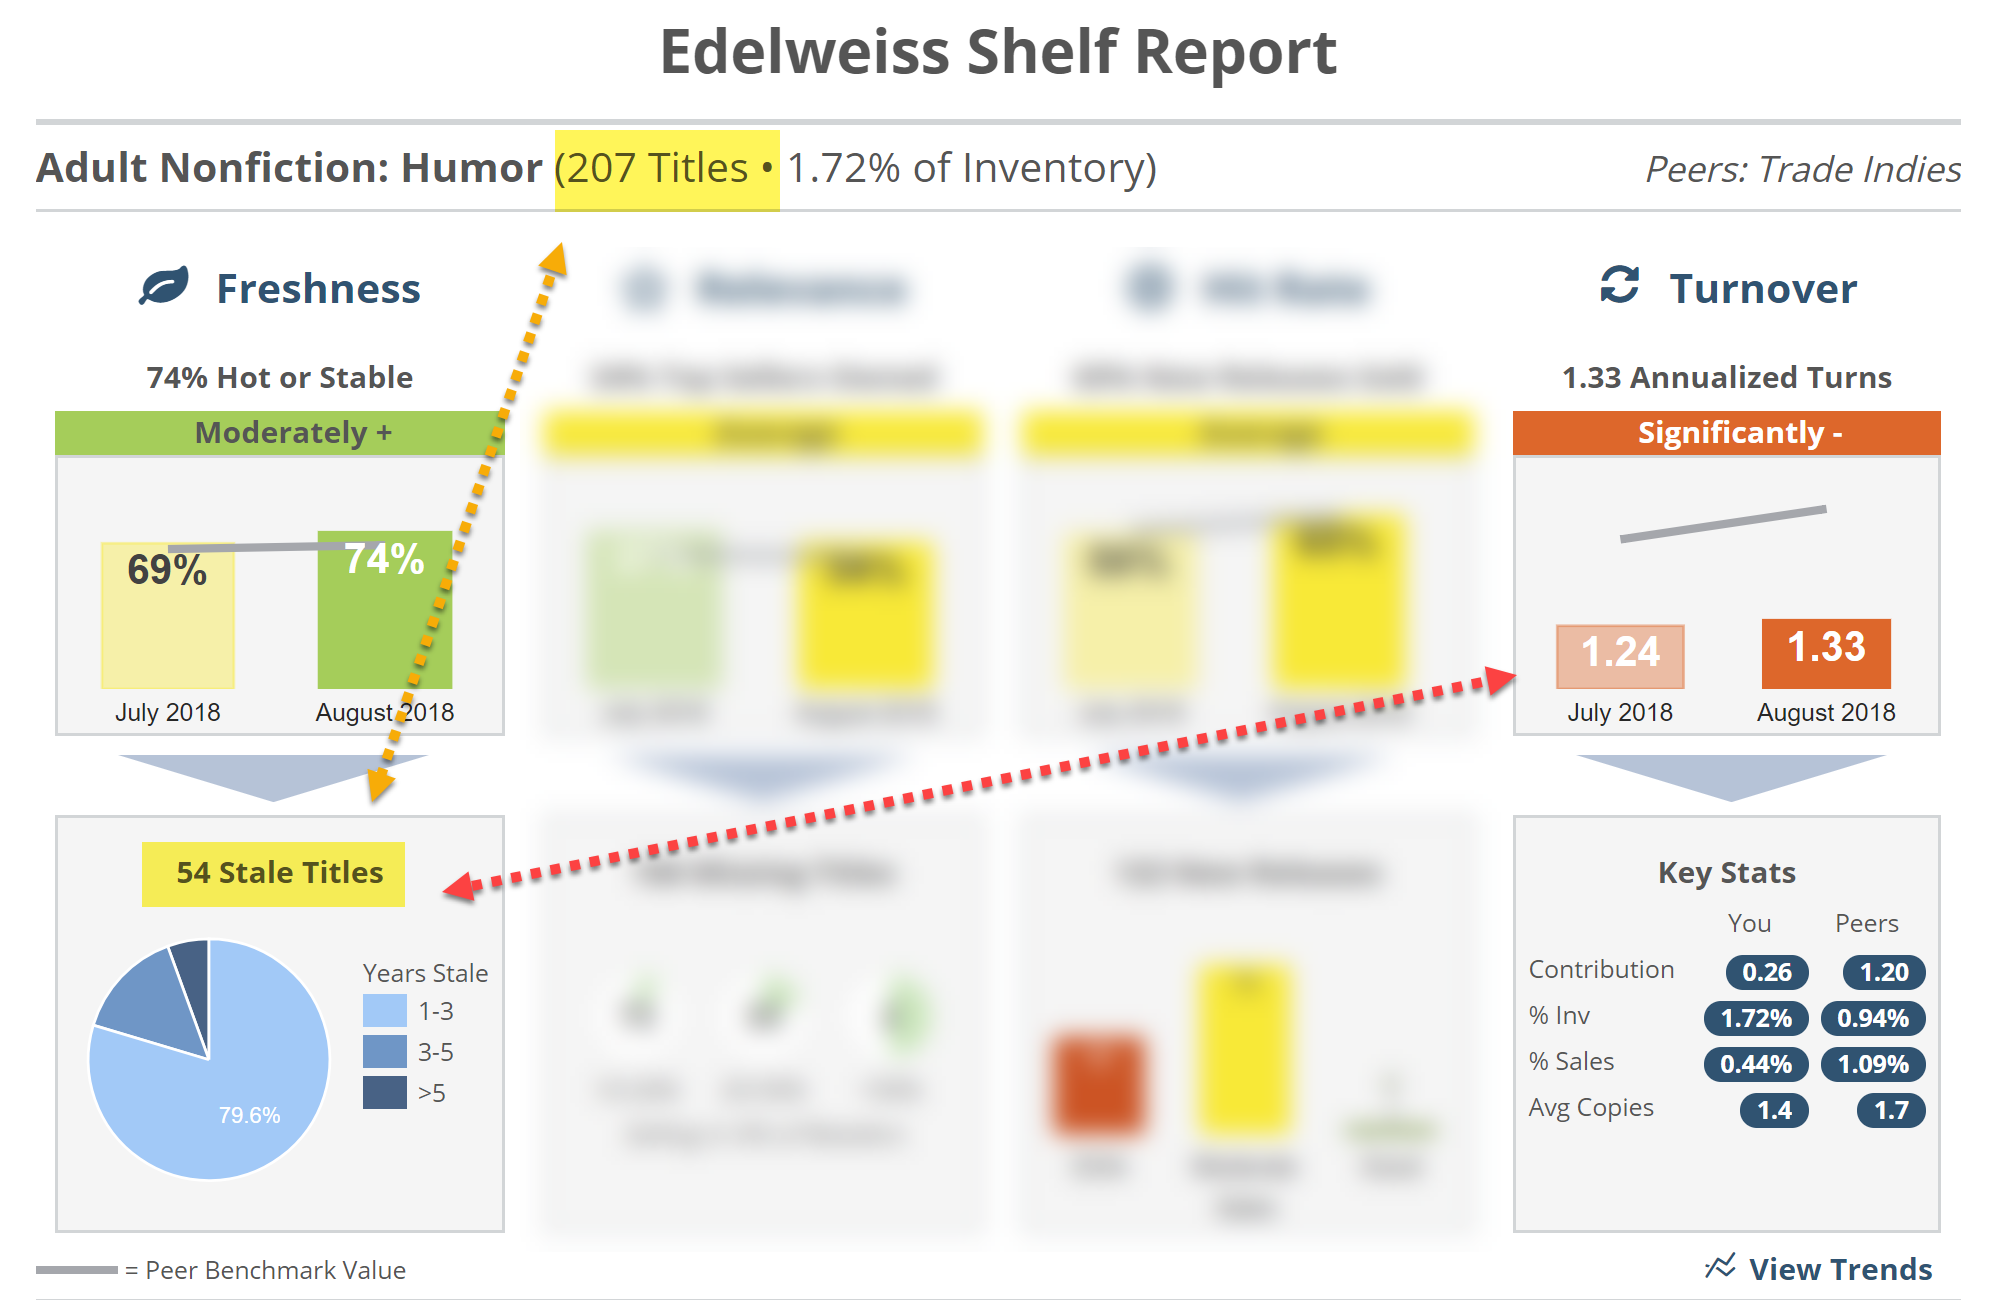
In the Humor example above, we see pretty low turns, and an illuminating 26% of that section are stale/unsold titles. A bookstore is constantly bringing in new titles, so it makes sense to constantly adjust the inventory to make room for those new titles and rid yourself of the stuff your customers don’t want.
The Key Stats box hows a few points of interest:
- Contribution: A ratio showing the difference between the % Inv and % Sales numbers. A Contribution number of “1” indicates balance. Less than 1 is overstocked, and over 1 is understocked, relatively speaking. The farther from 1, the more out of balance things are, technically speaking.
- % Inv: The % of your total book inventory represented by this genre.
- % Sales: The % of your total sales represented by this genre. In the example above, this store’s Literary Fiction sales account for 7.25% of the total. Not insignificant, especially when compared to the % Inv, which is much smaller.
- Avg Copies: The average number of copies on hand for each title.
If you work hard and manage your inventory effectively, you can see some extraordinary results: