
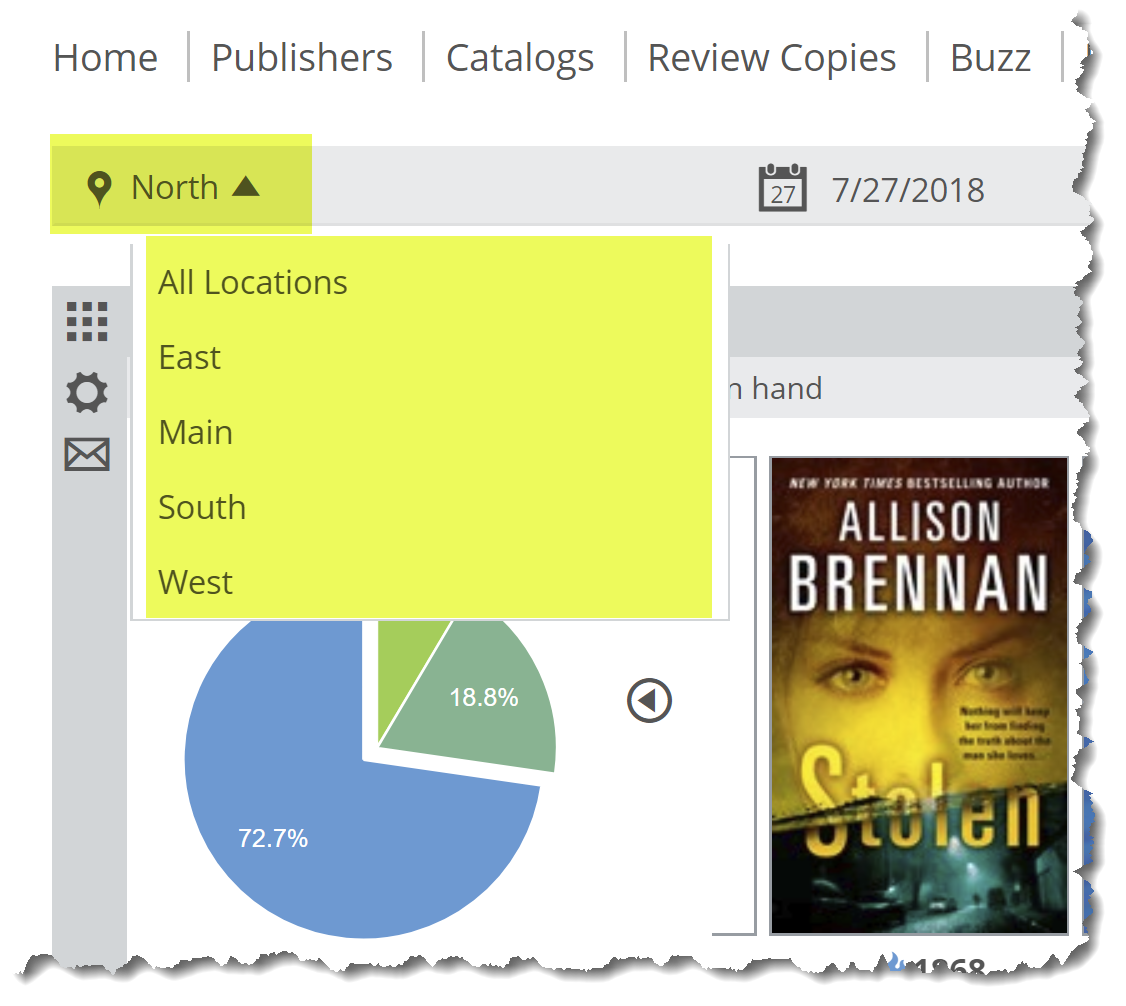
The first step is to select a location at the top of your Analytics page. This will be the ‘master’ location against which your other locations are measured.
Click the settings link on the far right of the lane to reveal a menu in which you can set a few parameters for this graph.
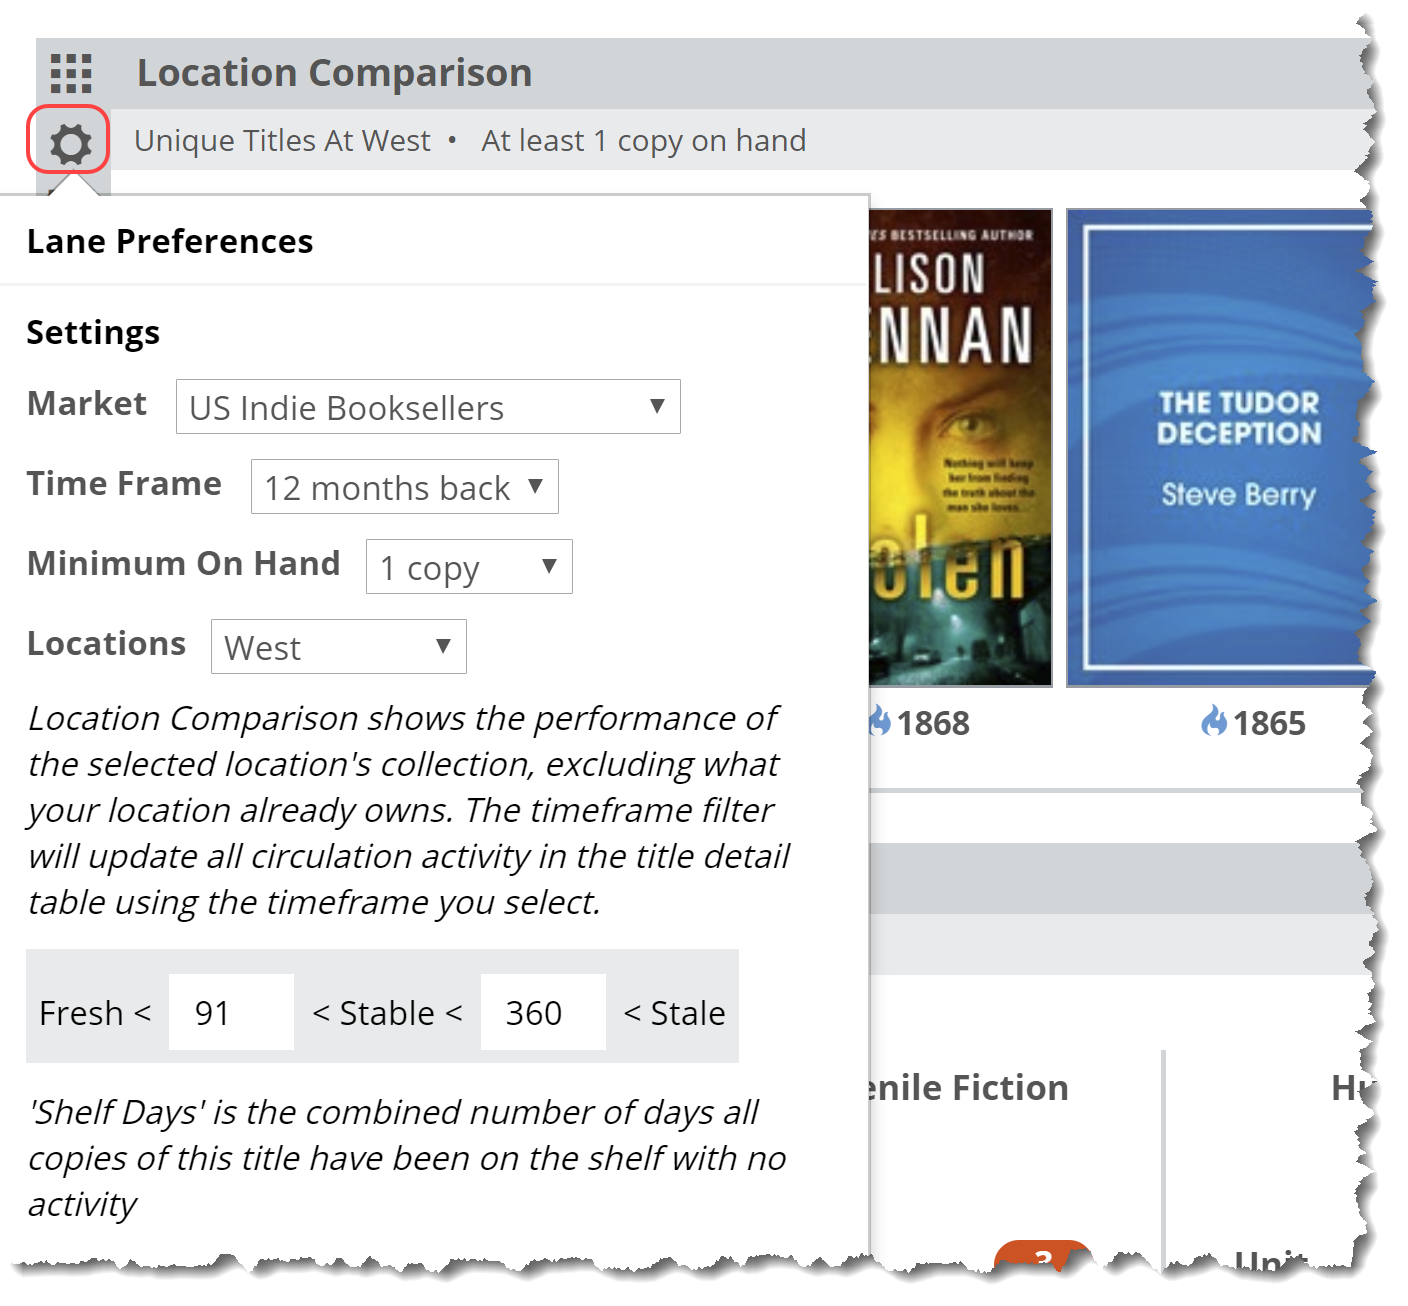
Here’s an explanation of each of your options:
Market:
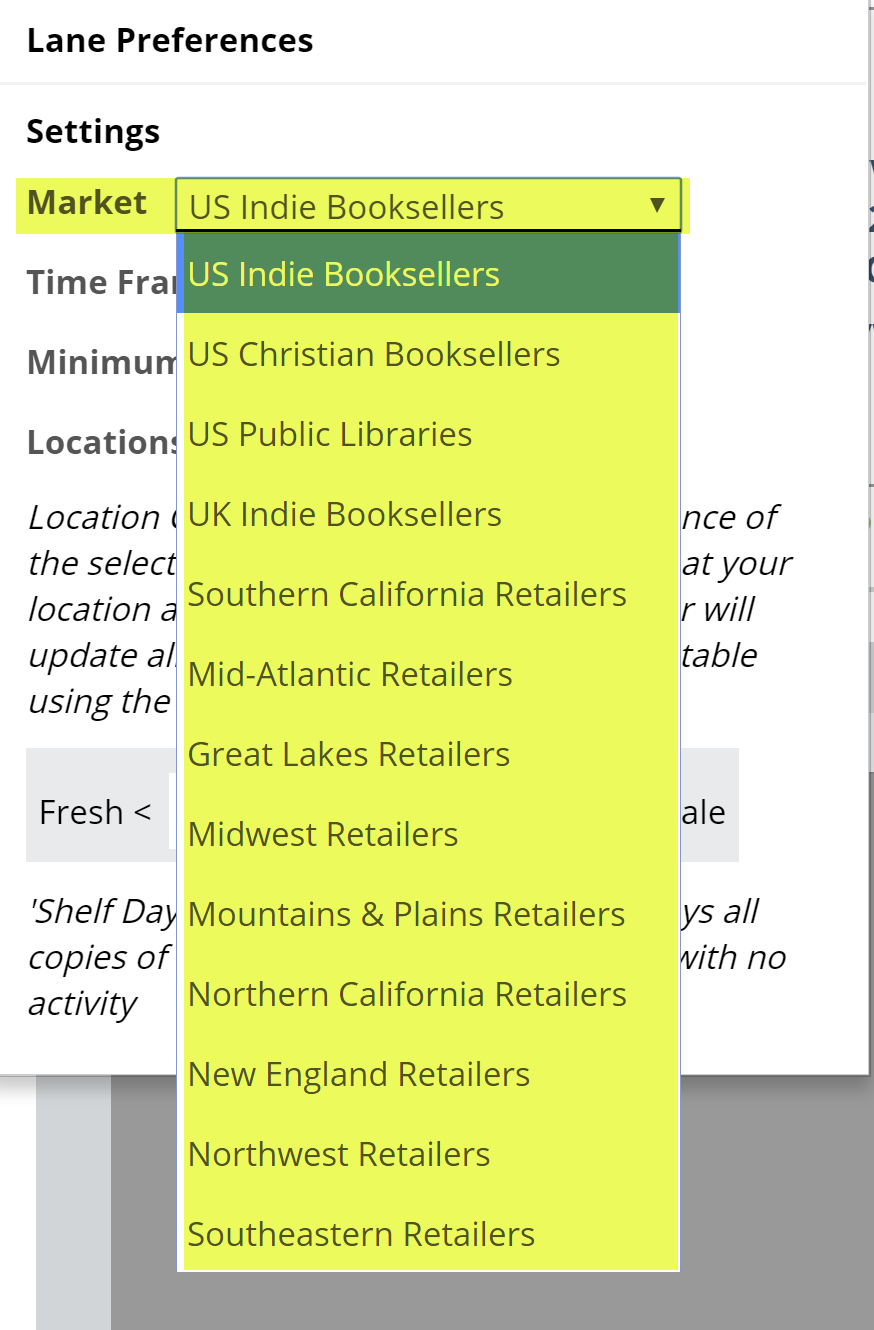
You can select to view results for your own market, or another market’s top-selling (or top-circulating, for libraries) titles. This filter will affect data seen in the Title Detail list for this lane.
Time Frame:
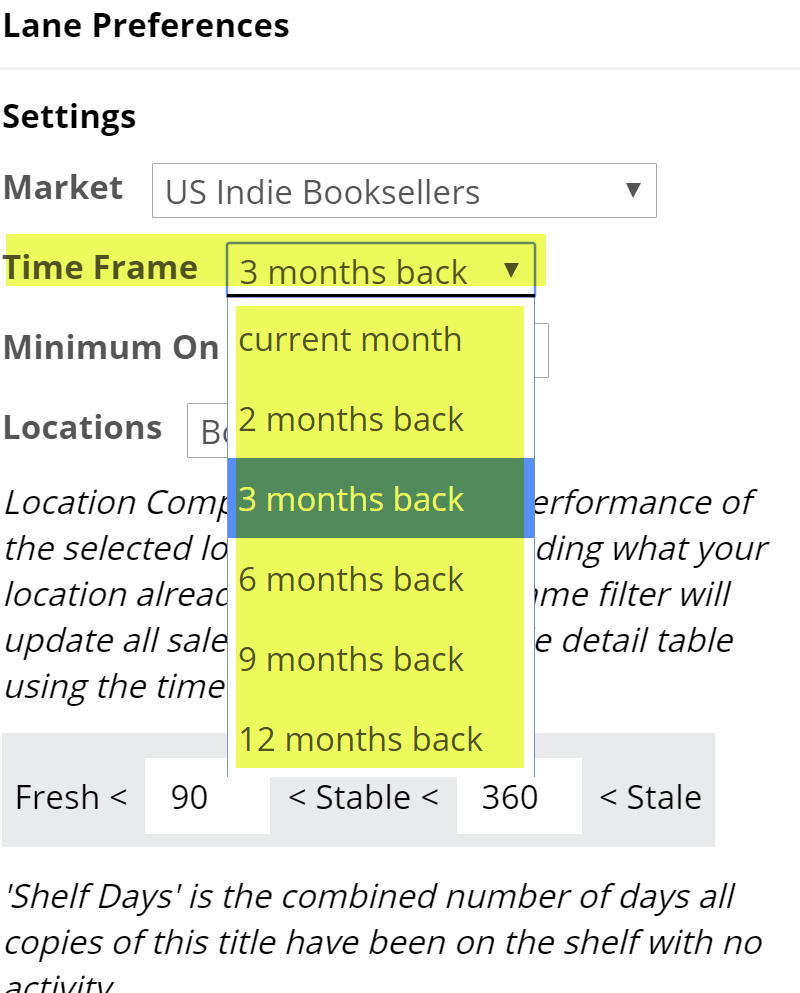
This filter will display in the unique location’s title activity data in the Title Detail chart, including sales numbers, etc.
Minimum On Hand:
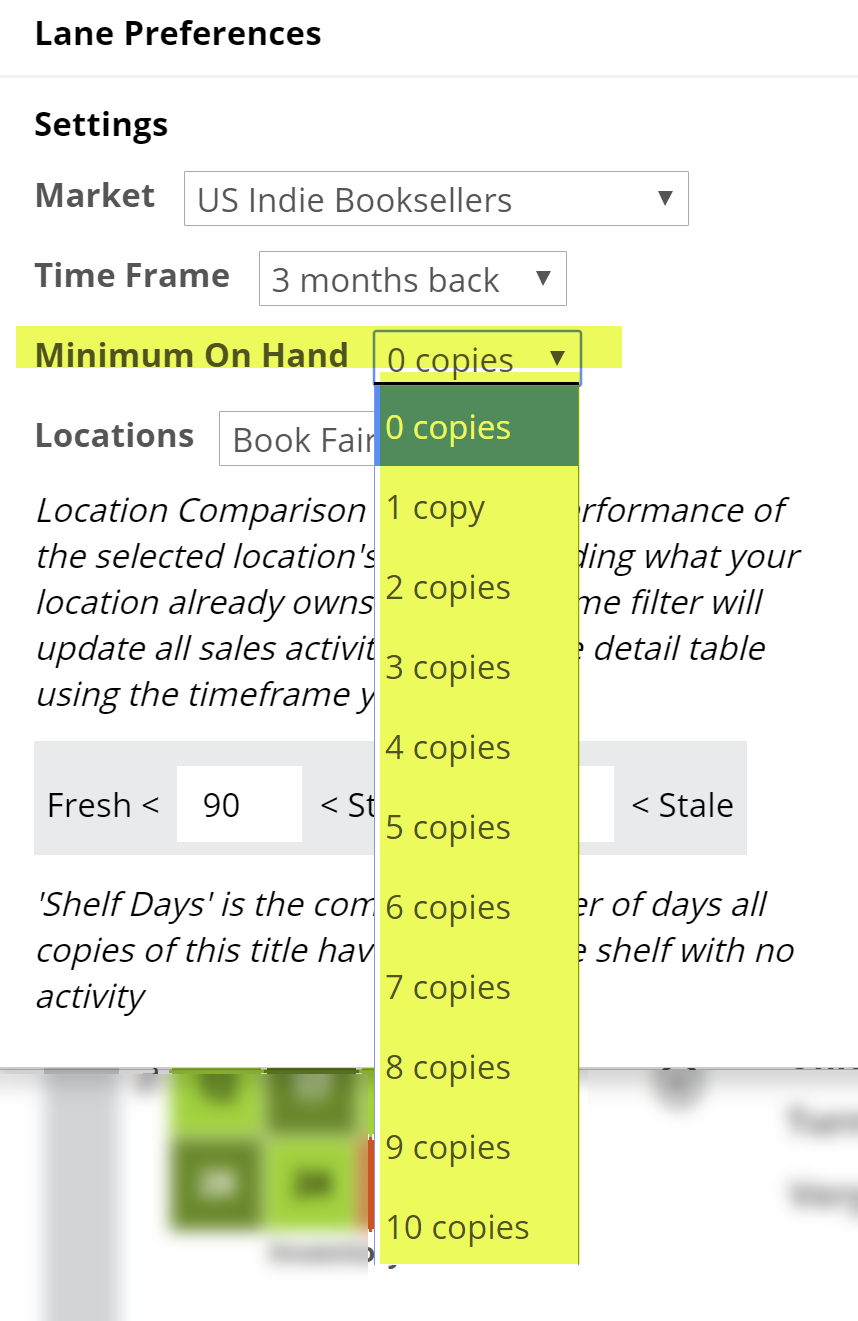
Setting this filter high will show just the titles for which the Unique Location has multiple copies. For example, setting the Minimum on Hand to “10” means that you’re only going to see those titles of which the unique location owns at least 10 copies. That’s likely a relatively small number of titles, which allows this graph to be highly targeted.
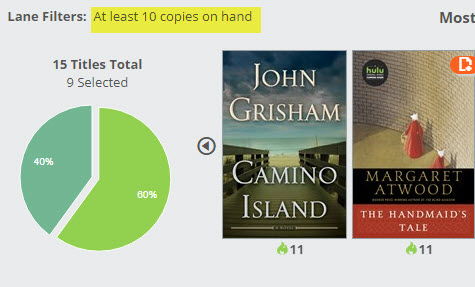
The graph will show which of those titles are circulating great, and which might be languishing.
Locations:
 This is the location whose titles you want to see…titles unique to this location, not owned by the location indicated at the top of your page.
Shelf Days:

Shelf Days are fully explained here. This essentially allows you to set an upper and lower performance measure on your inventory. So, how well, and how quickly, are your titles selling?